Labour Market Impacts of AI/AGI
June 24, 2026
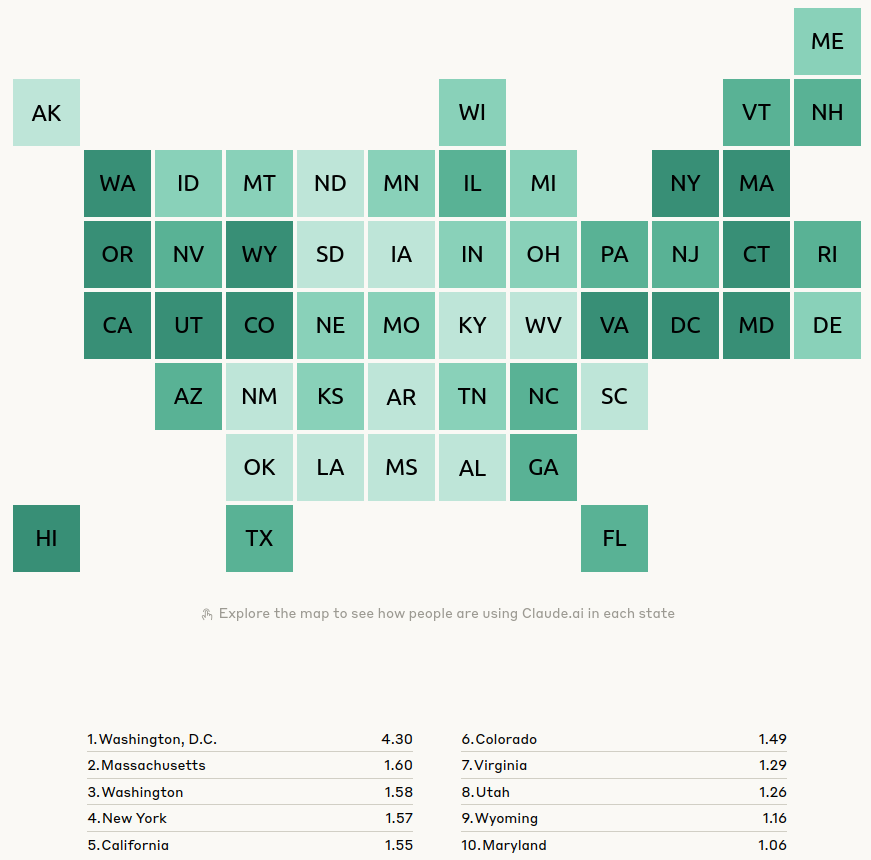
US usage
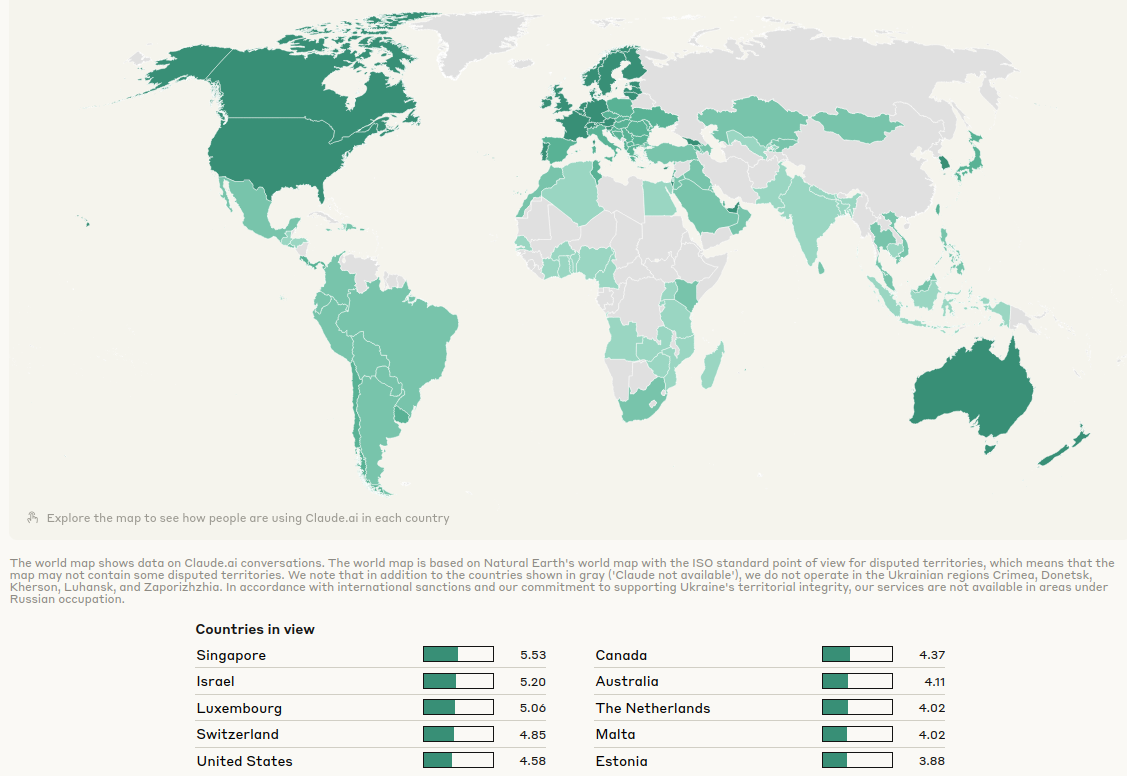
global usage
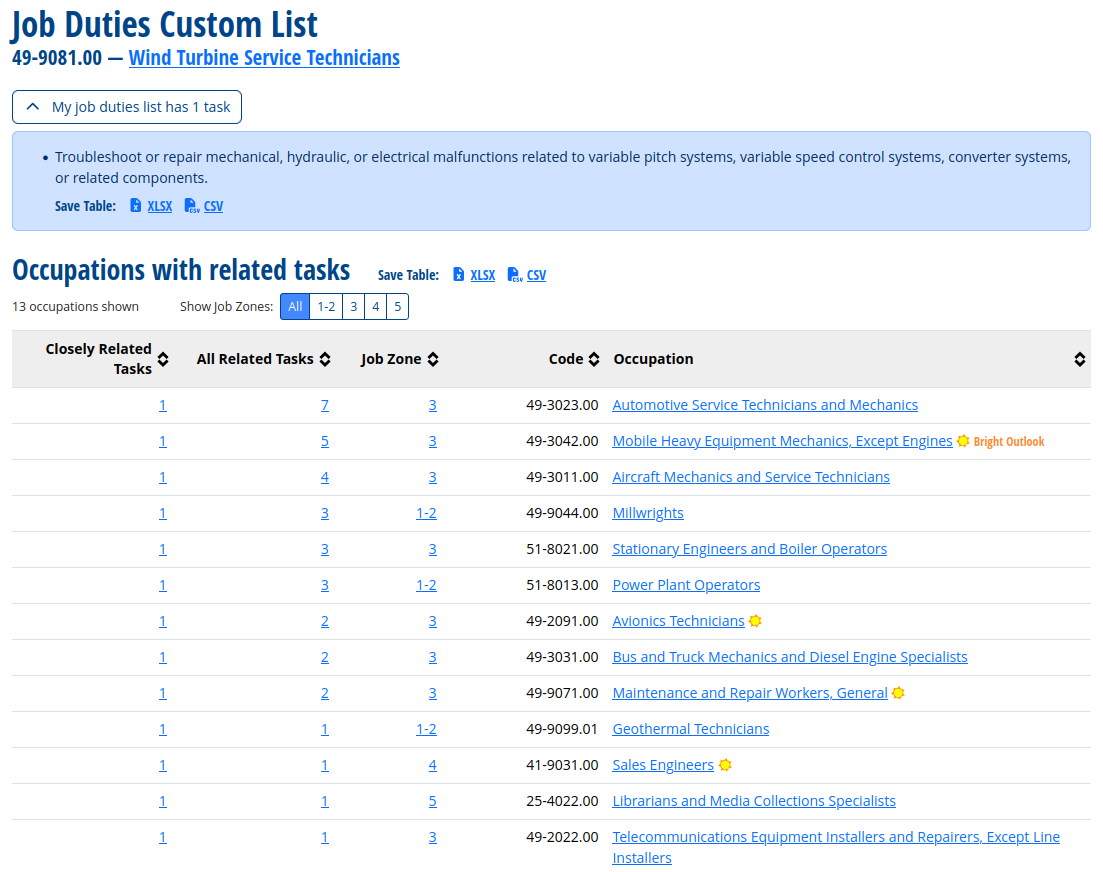
O*NET database: jobs are made of tasks

- “enumerates tasks associated with around 800 unique occupations in the US”
- 18,796 tasks: “Occupation-specific activities and duties performed in a job”
Task-level exposure (Eloundou et al., 2023, 2024)
\[\tilde{r}_t \equiv \mathbb{1} \left\{ WorkUsage_t \ge 100 \right\} \times \mathbb{1} \left\{ \beta_1 \ge 0.5 \right\} \times \alpha_t\]
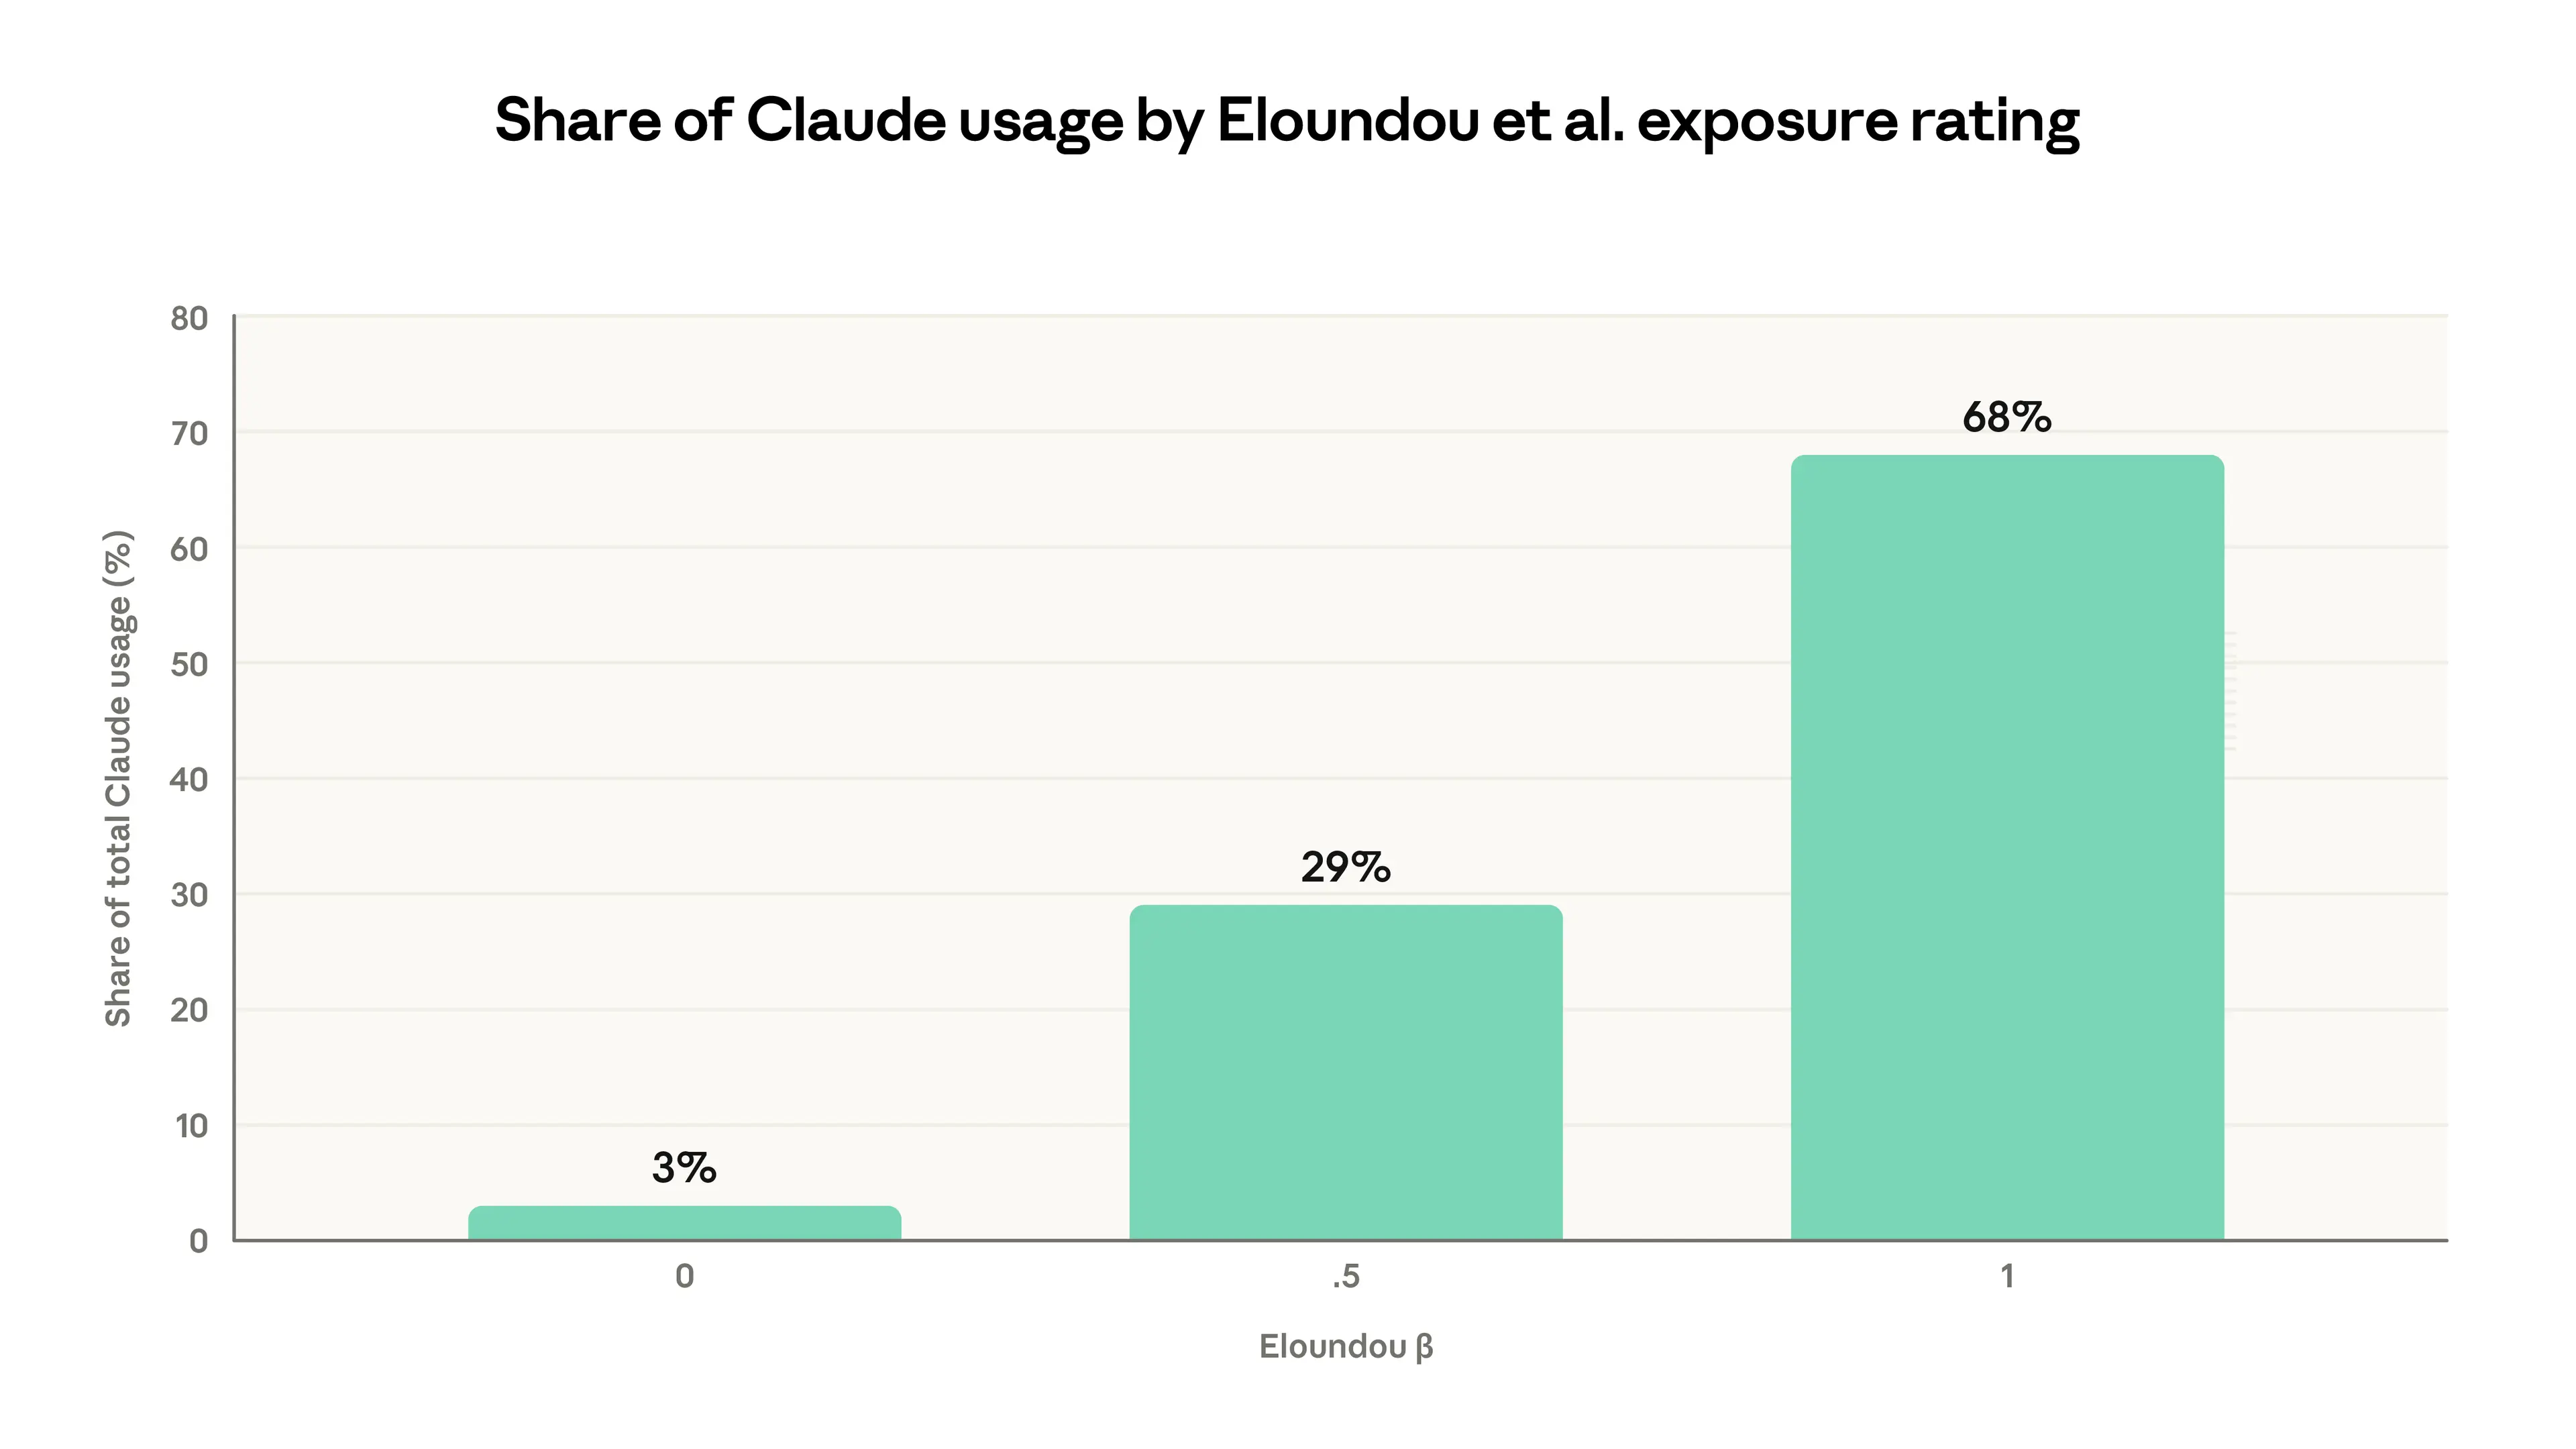
- “\(\beta\) scores tasks on a simple scale: \(1\) if a task can be doubled in speed by an LLM alone, \(0.5\) if it requires additional tools or software built on top of the LLM, and \(0\) otherwise.”
- “\(\beta_t\) is … set to 1 if \(\beta\) is above zero … because many LLMs today will have [web search and image recognition] capabilities”
\[\alpha_t \equiv \frac{1}{2} \left( 1 + \frac{ClaudeWorkUsage_t \times AutoShare_t + APIUsage_t}{ClaudeWorkUsage_t + APIUsage_t} \right)\]
Task-level automation v augmentation (Appel et al., 2026; 2025)
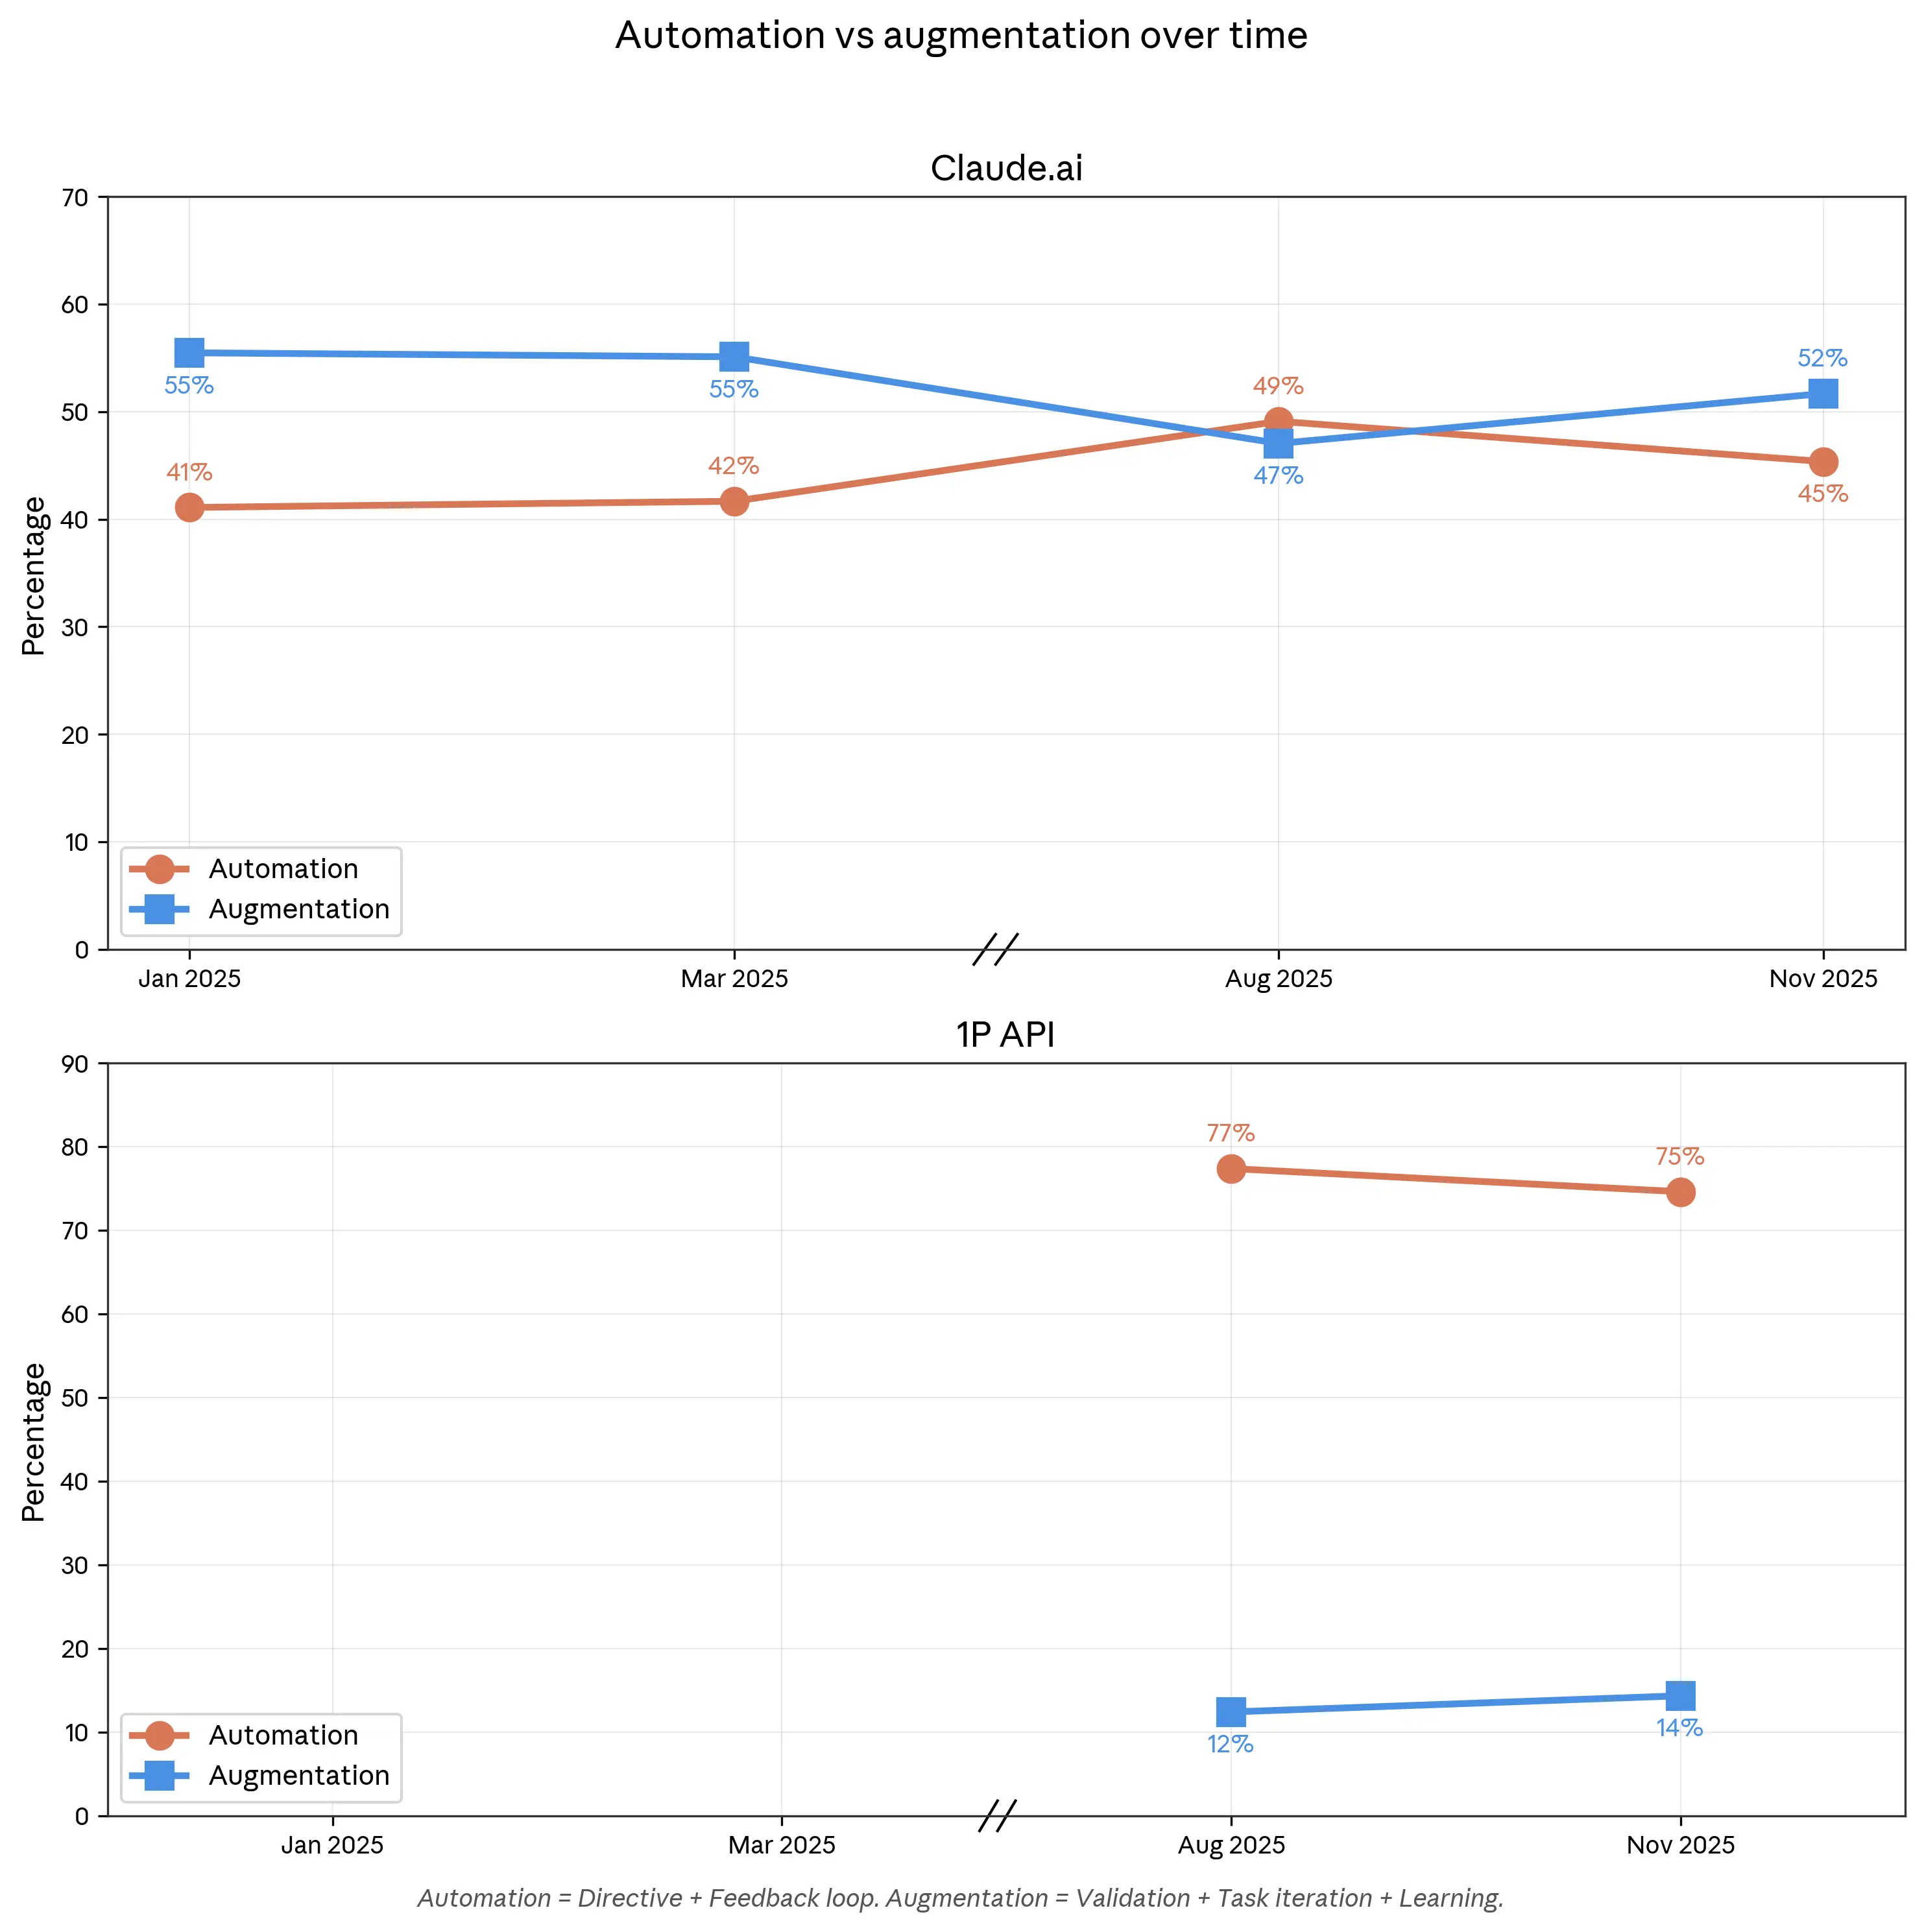
Automation: focused on task completion
- Directive: LLM completes a task with minimal back-and-forth
- Feedback Loops: automate tasks and provide feedback to LLM as needed
Augmentation: collaborative interaction
- Learning: ask LLM for info, explanations
- Task Iteration: iterate on tasks collaboratively with LLM
- Validation: ask LLM for feedback on their work
Key finding: AI coverage is a fraction of what’s feasible
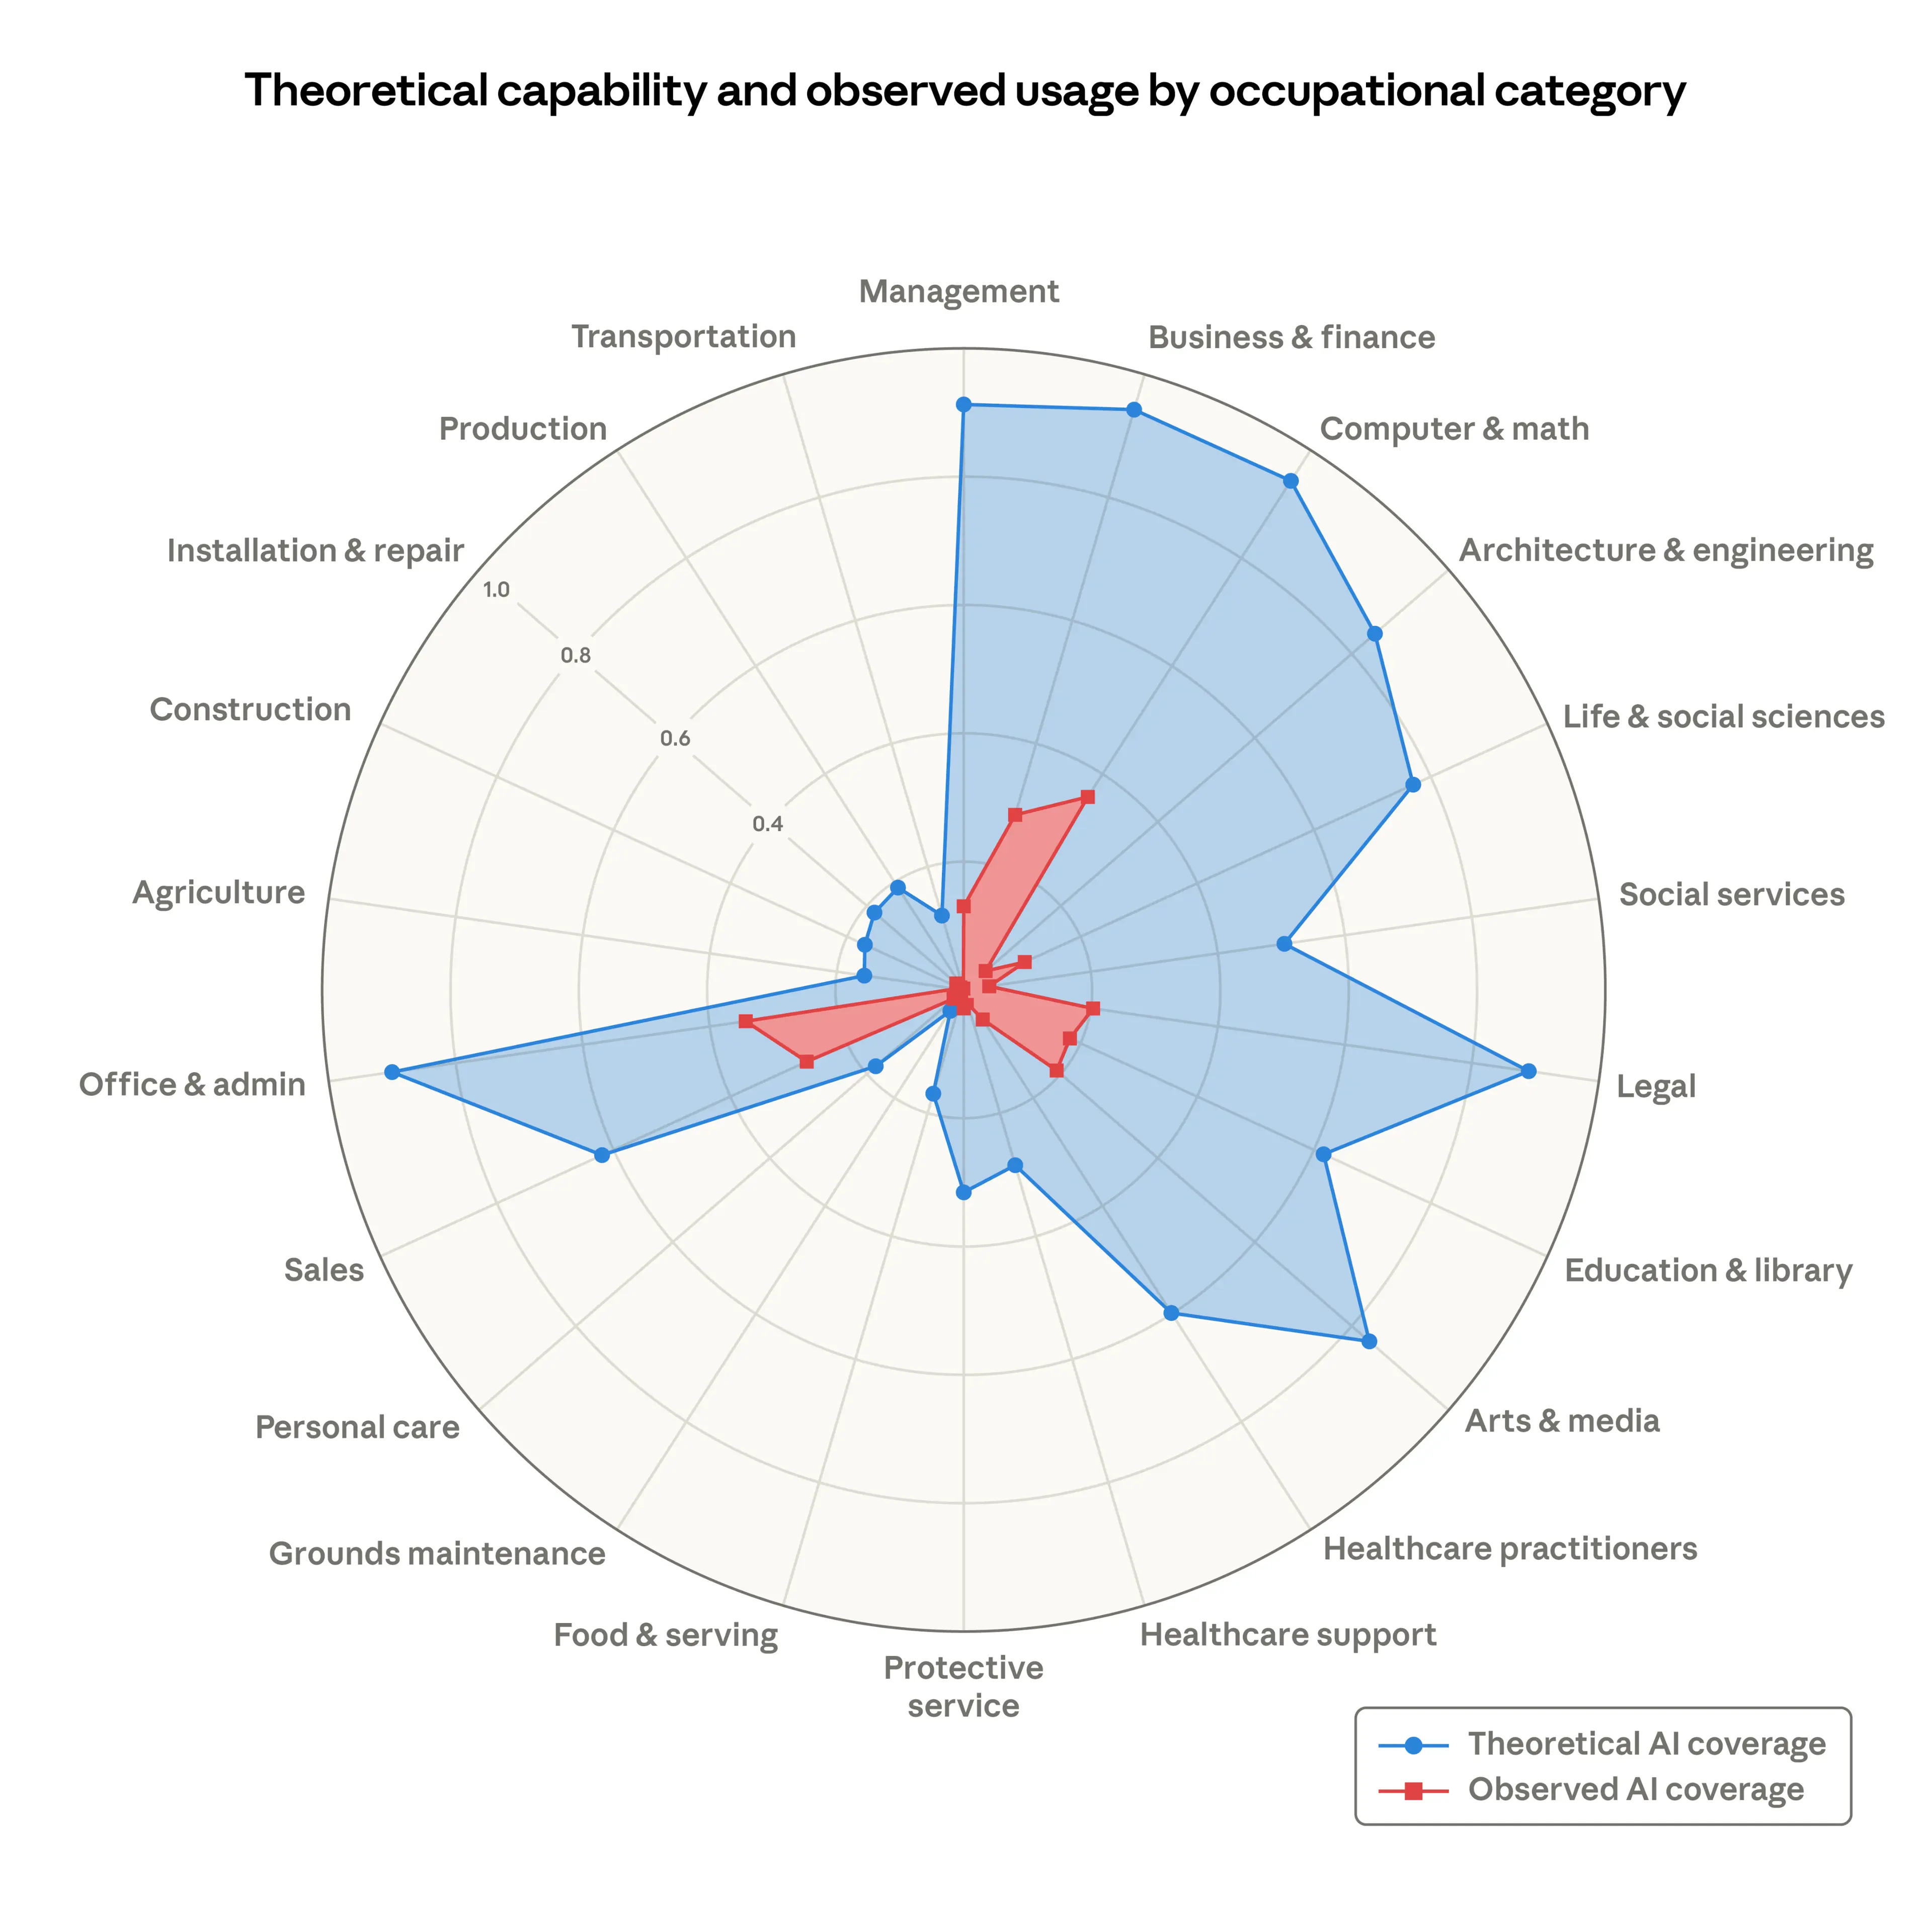
- “AI is far from reaching its theoretical capability”
- blue area: theoretical coverage derived from Eloundou et al. (2023)
- red area: “how people are using Claude in professional settings”
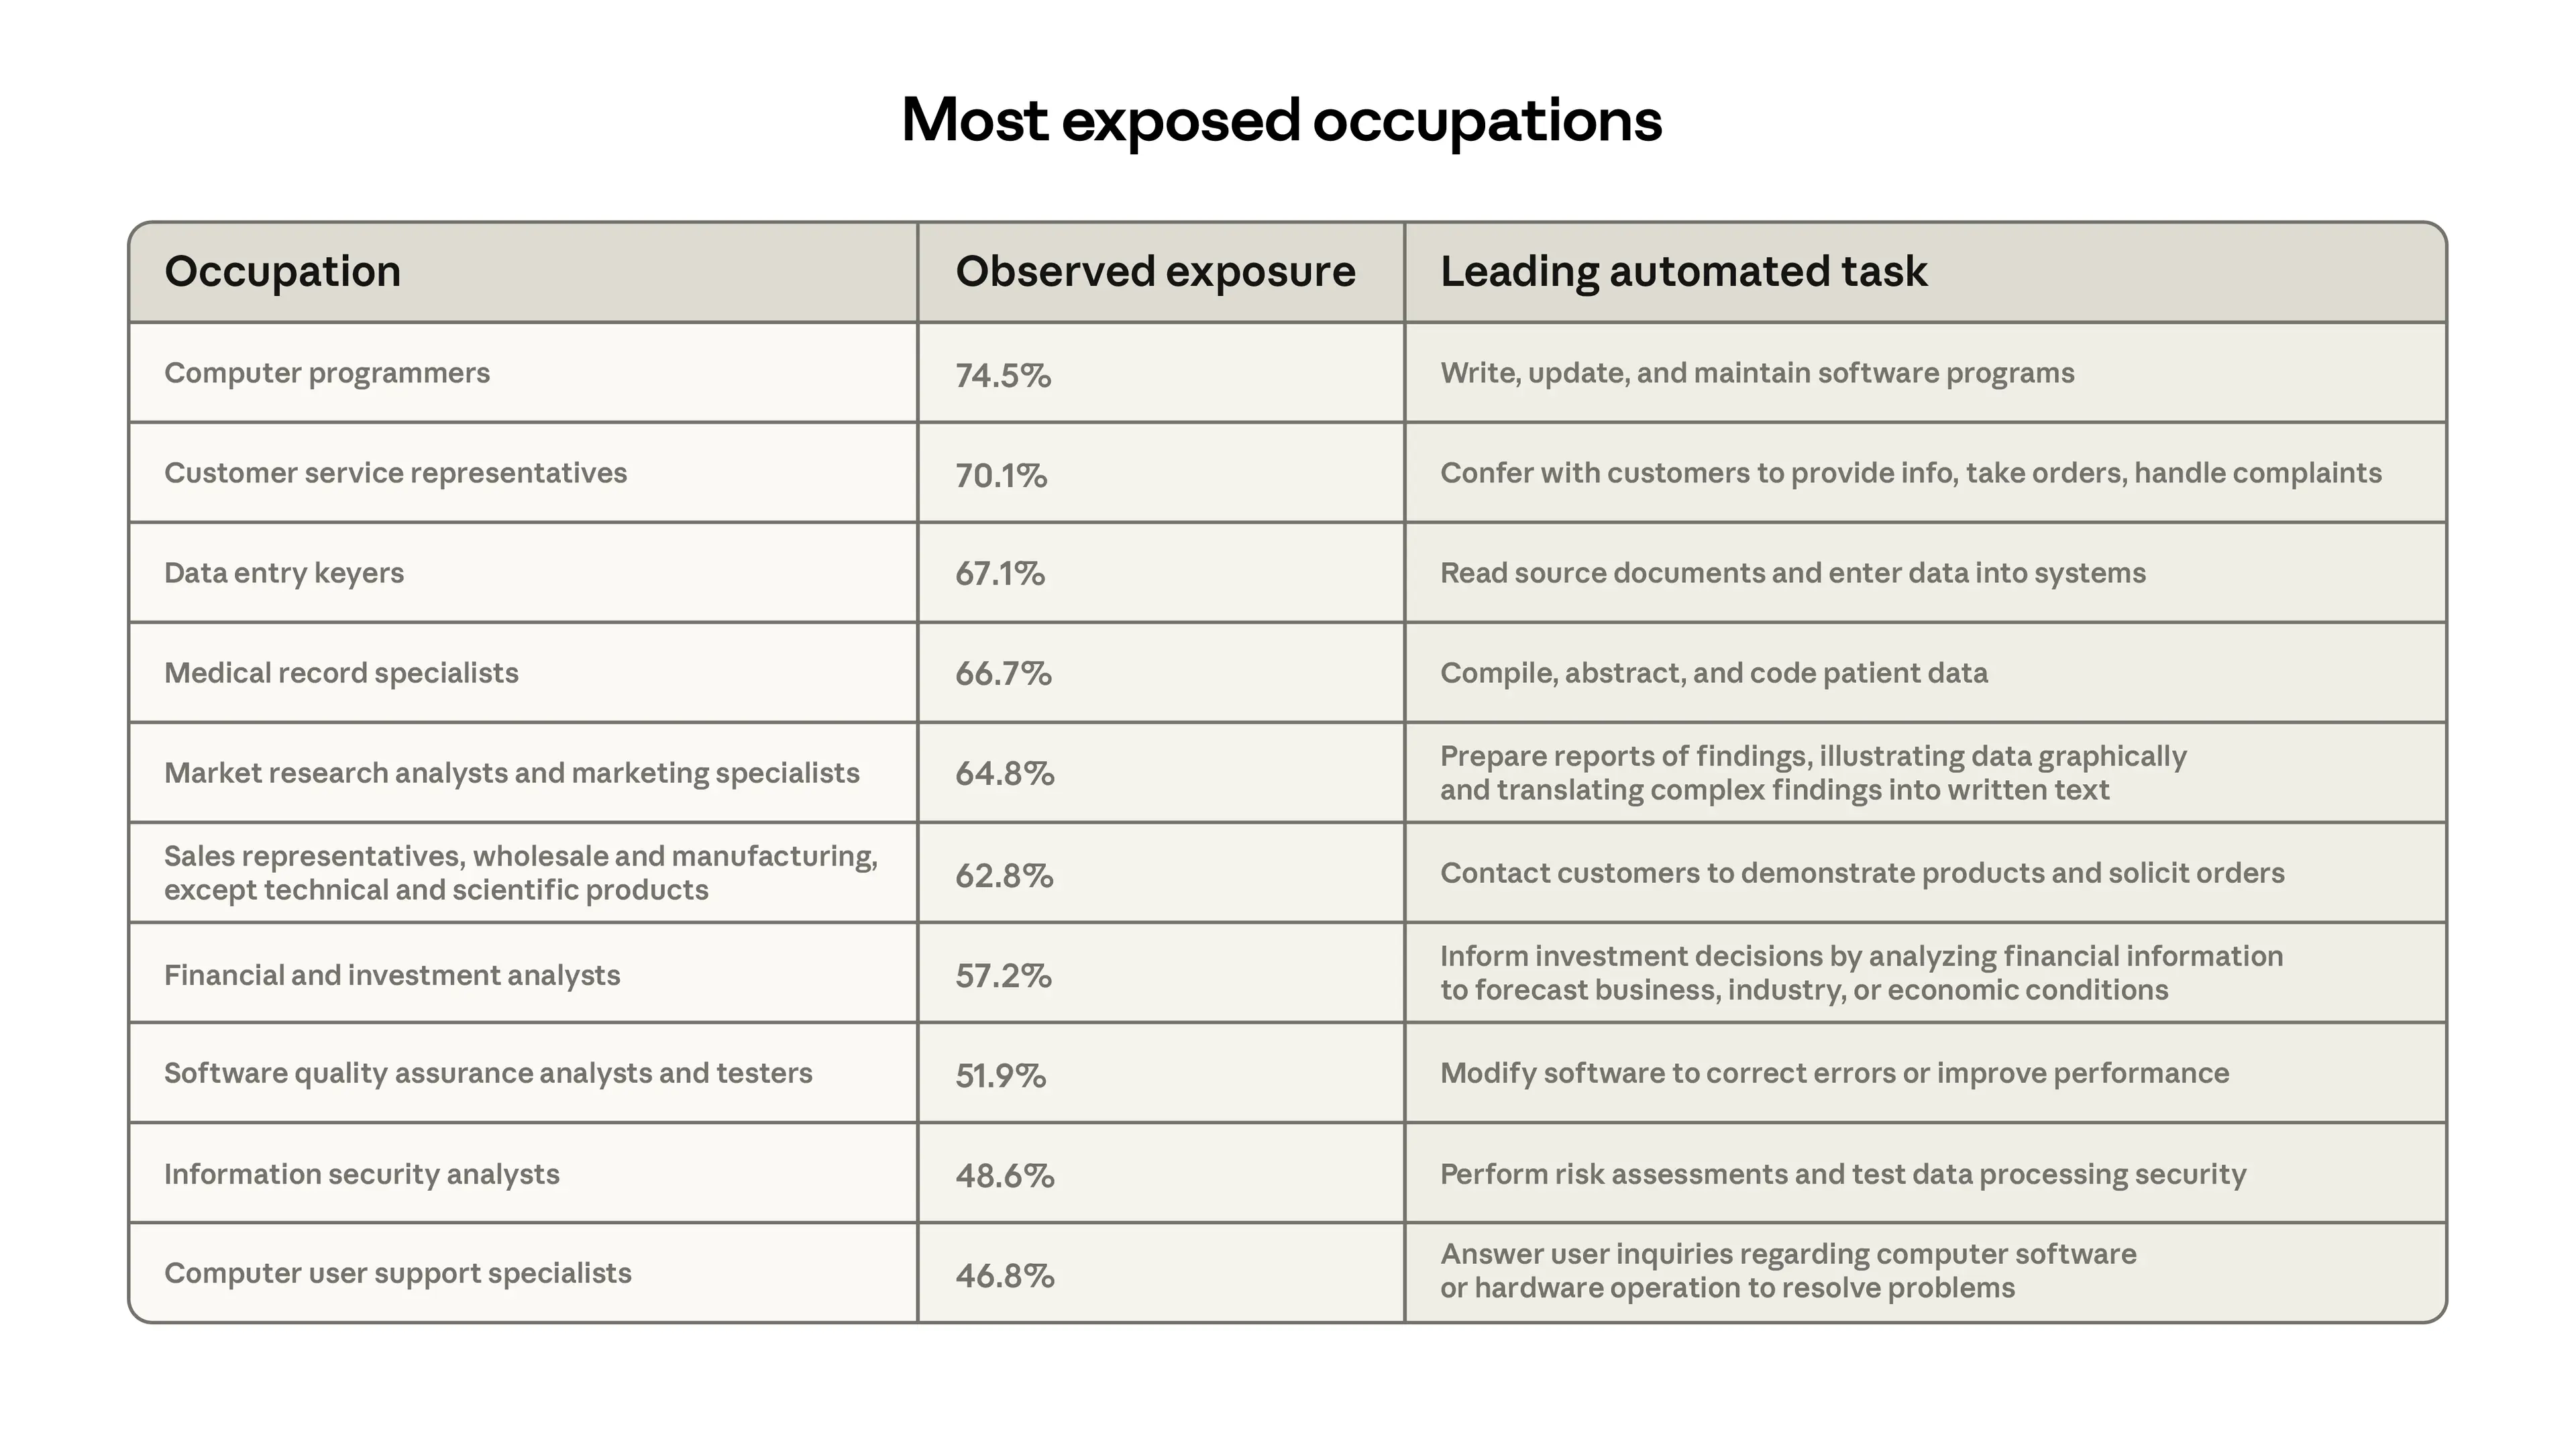
Key finding: slower growth for more exposed professions
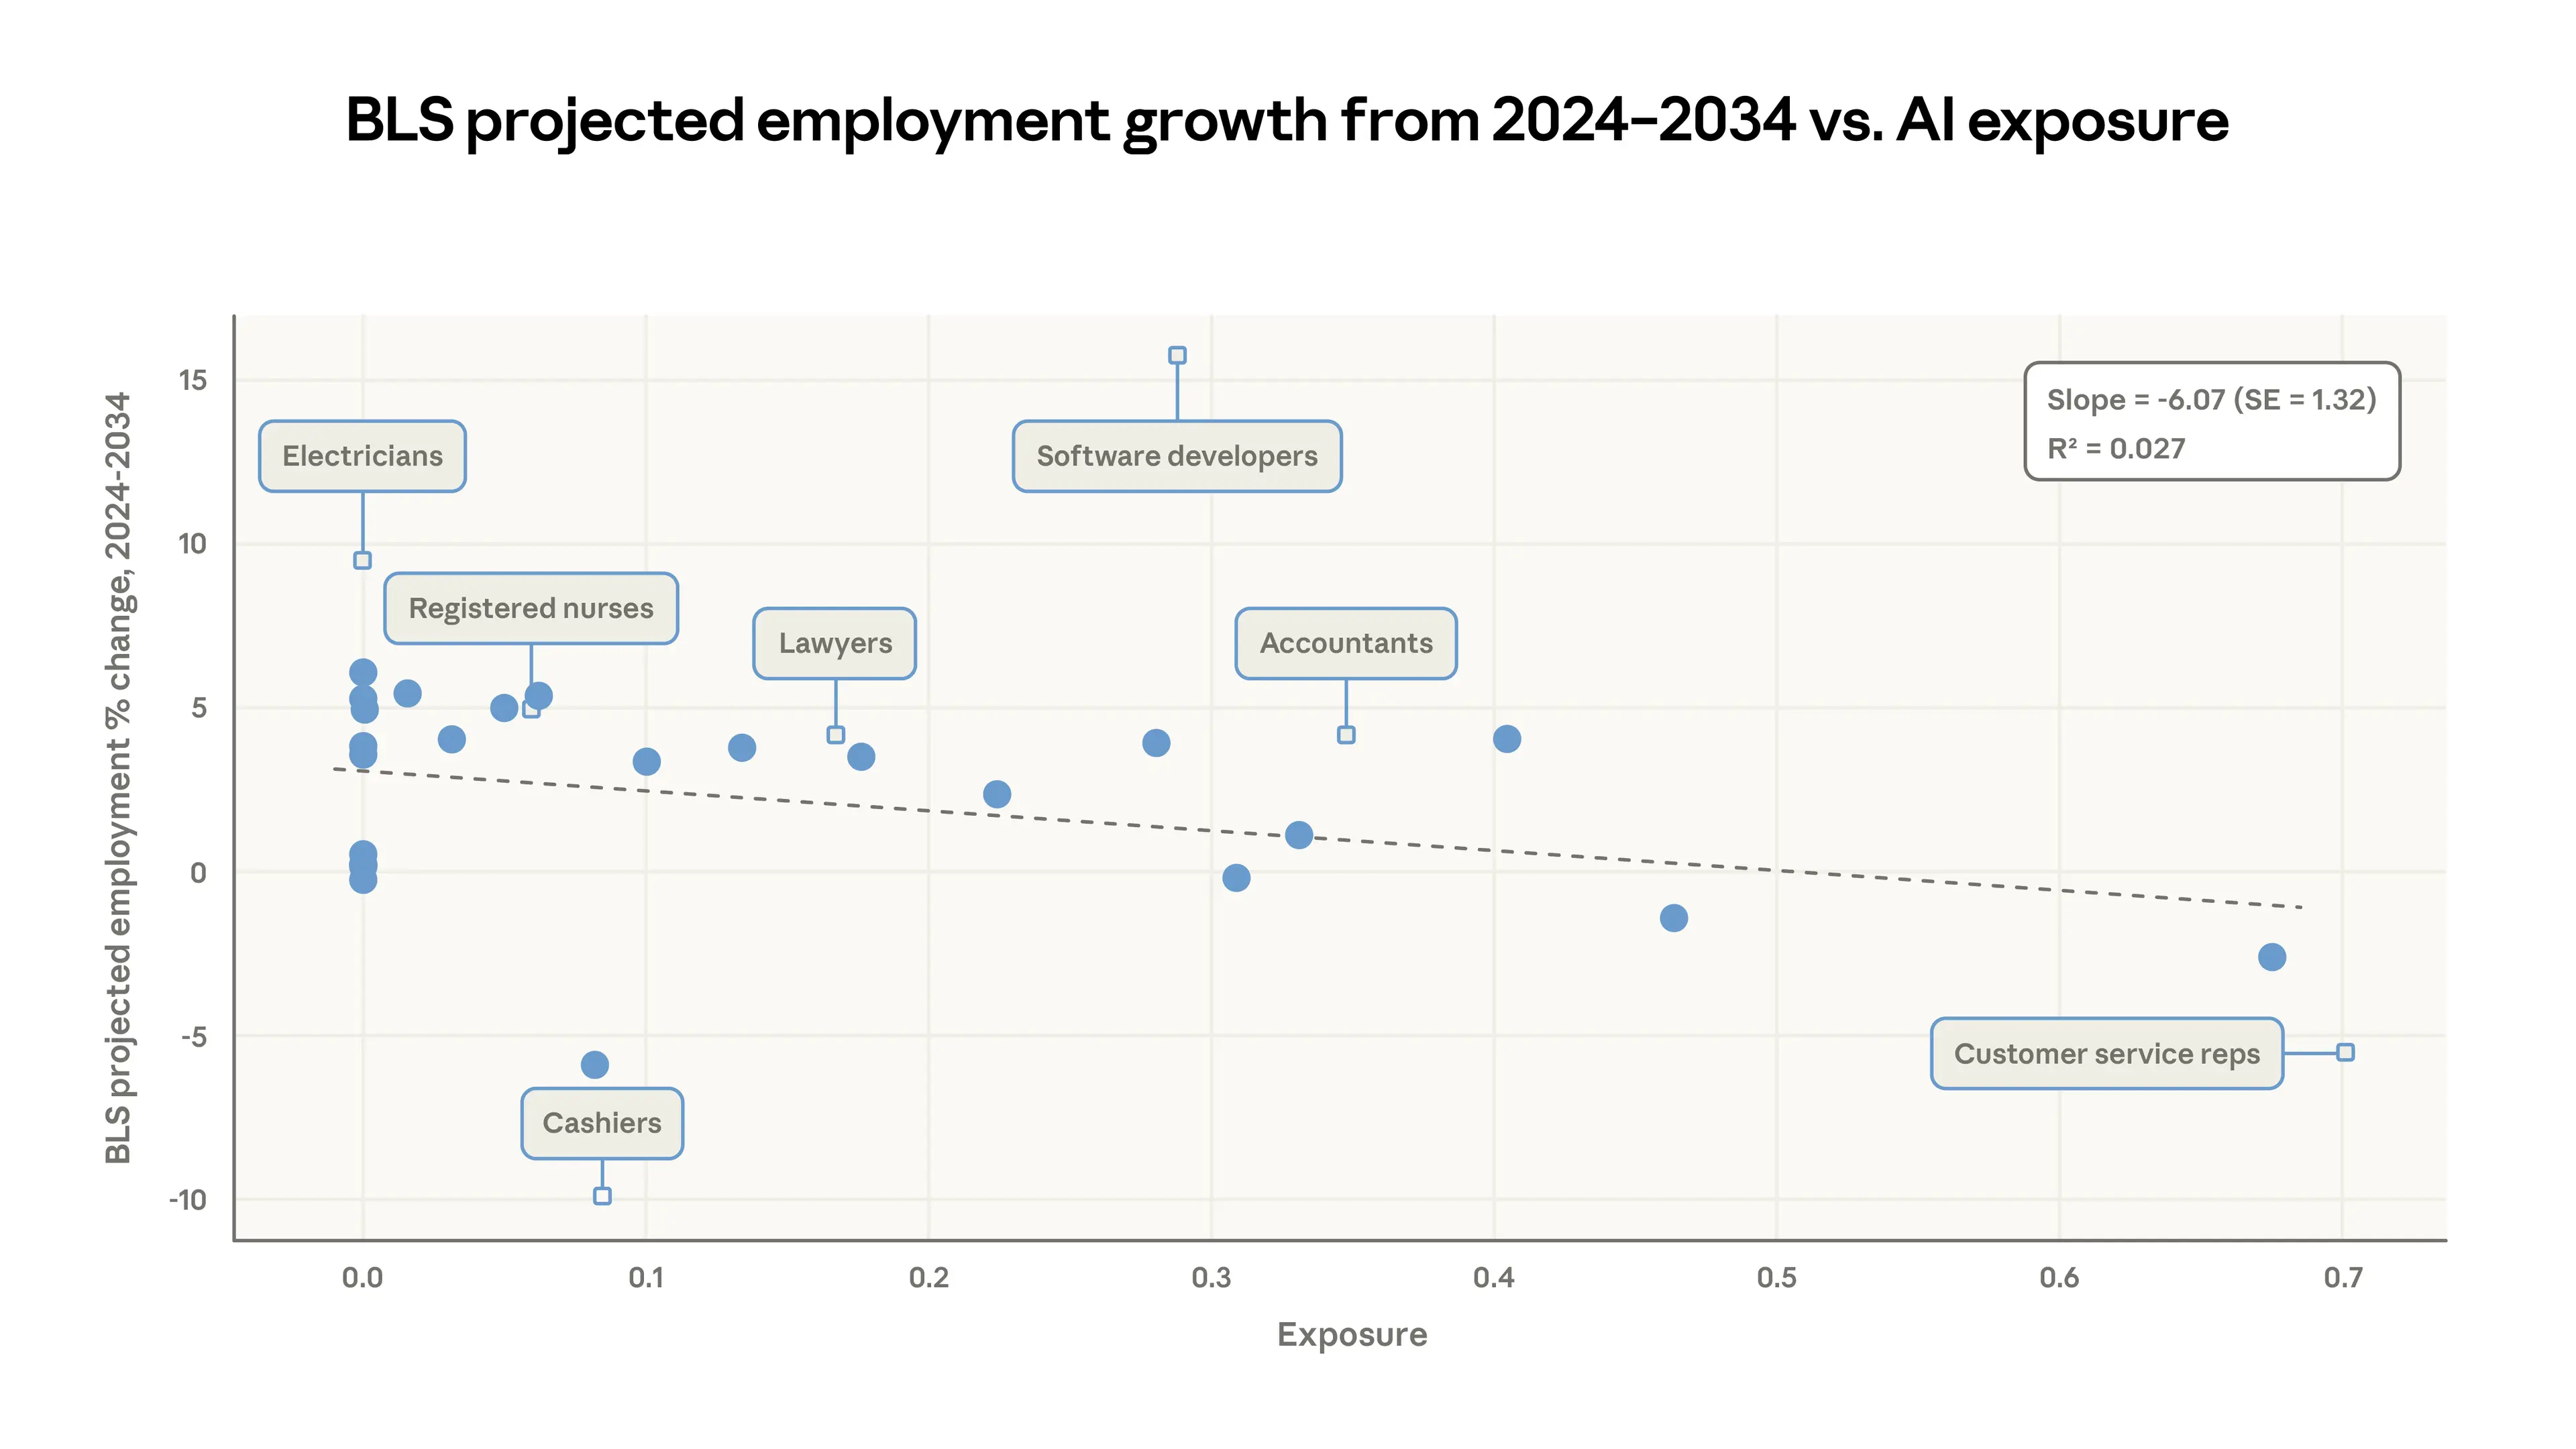
- “Occupations with higher observed exposure are projected by the BLS to grow less through 2034”
- “a binned scatterplot with 25 equally-sized bins. Each solid dot shows the average observed exposure and projected employment change for one of the bins. The dashed line shows a simple linear regression fit, weighted by current employment levels.”
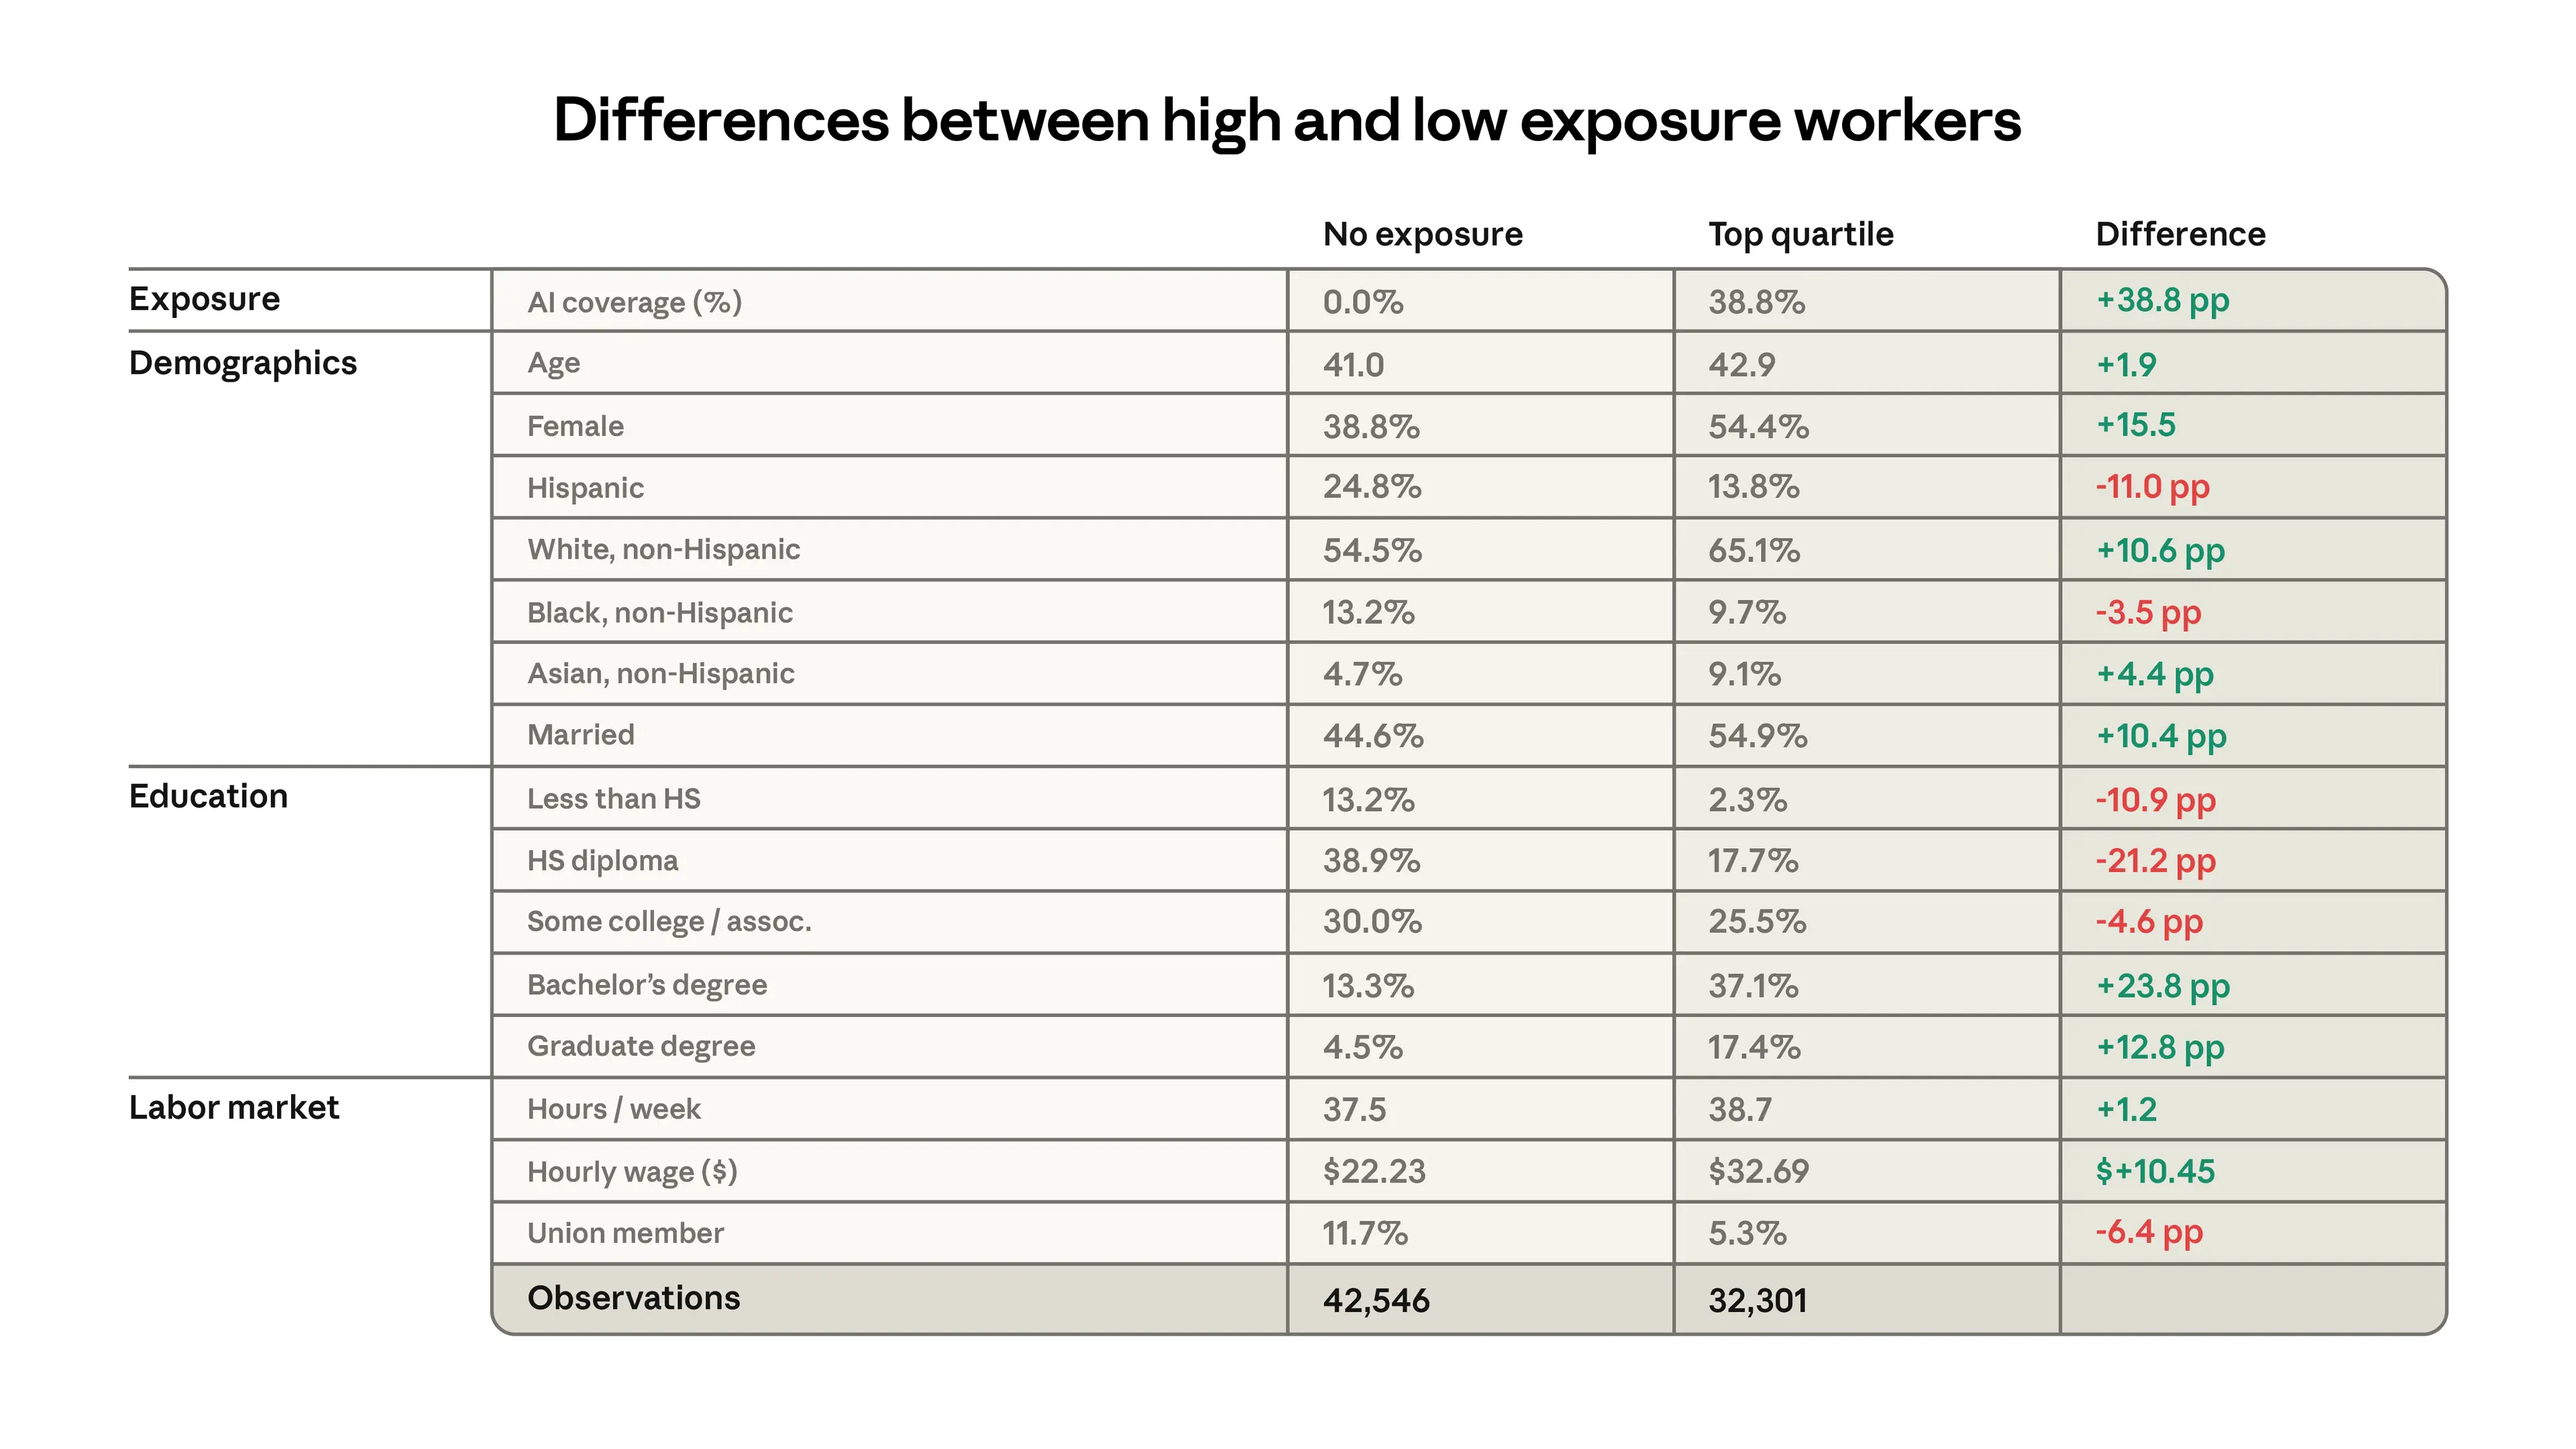
Key finding: exposed are older, female, more educated, higher-paid
- “Workers in the most exposed professions are more likely to be older, female, more educated, and higher-paid”
- “The more exposed group is 16 percentage points more likely to be female, 11 percentage points more likely to be white, and almost twice as likely to be Asian. They earn 47% more, on average, and have higher levels of education. For example, people with graduate degrees are 4.5% of the unexposed group, but 17.4% of the most exposed group, an almost fourfold difference.”
Key finding: evidence that younger workers are more at risk
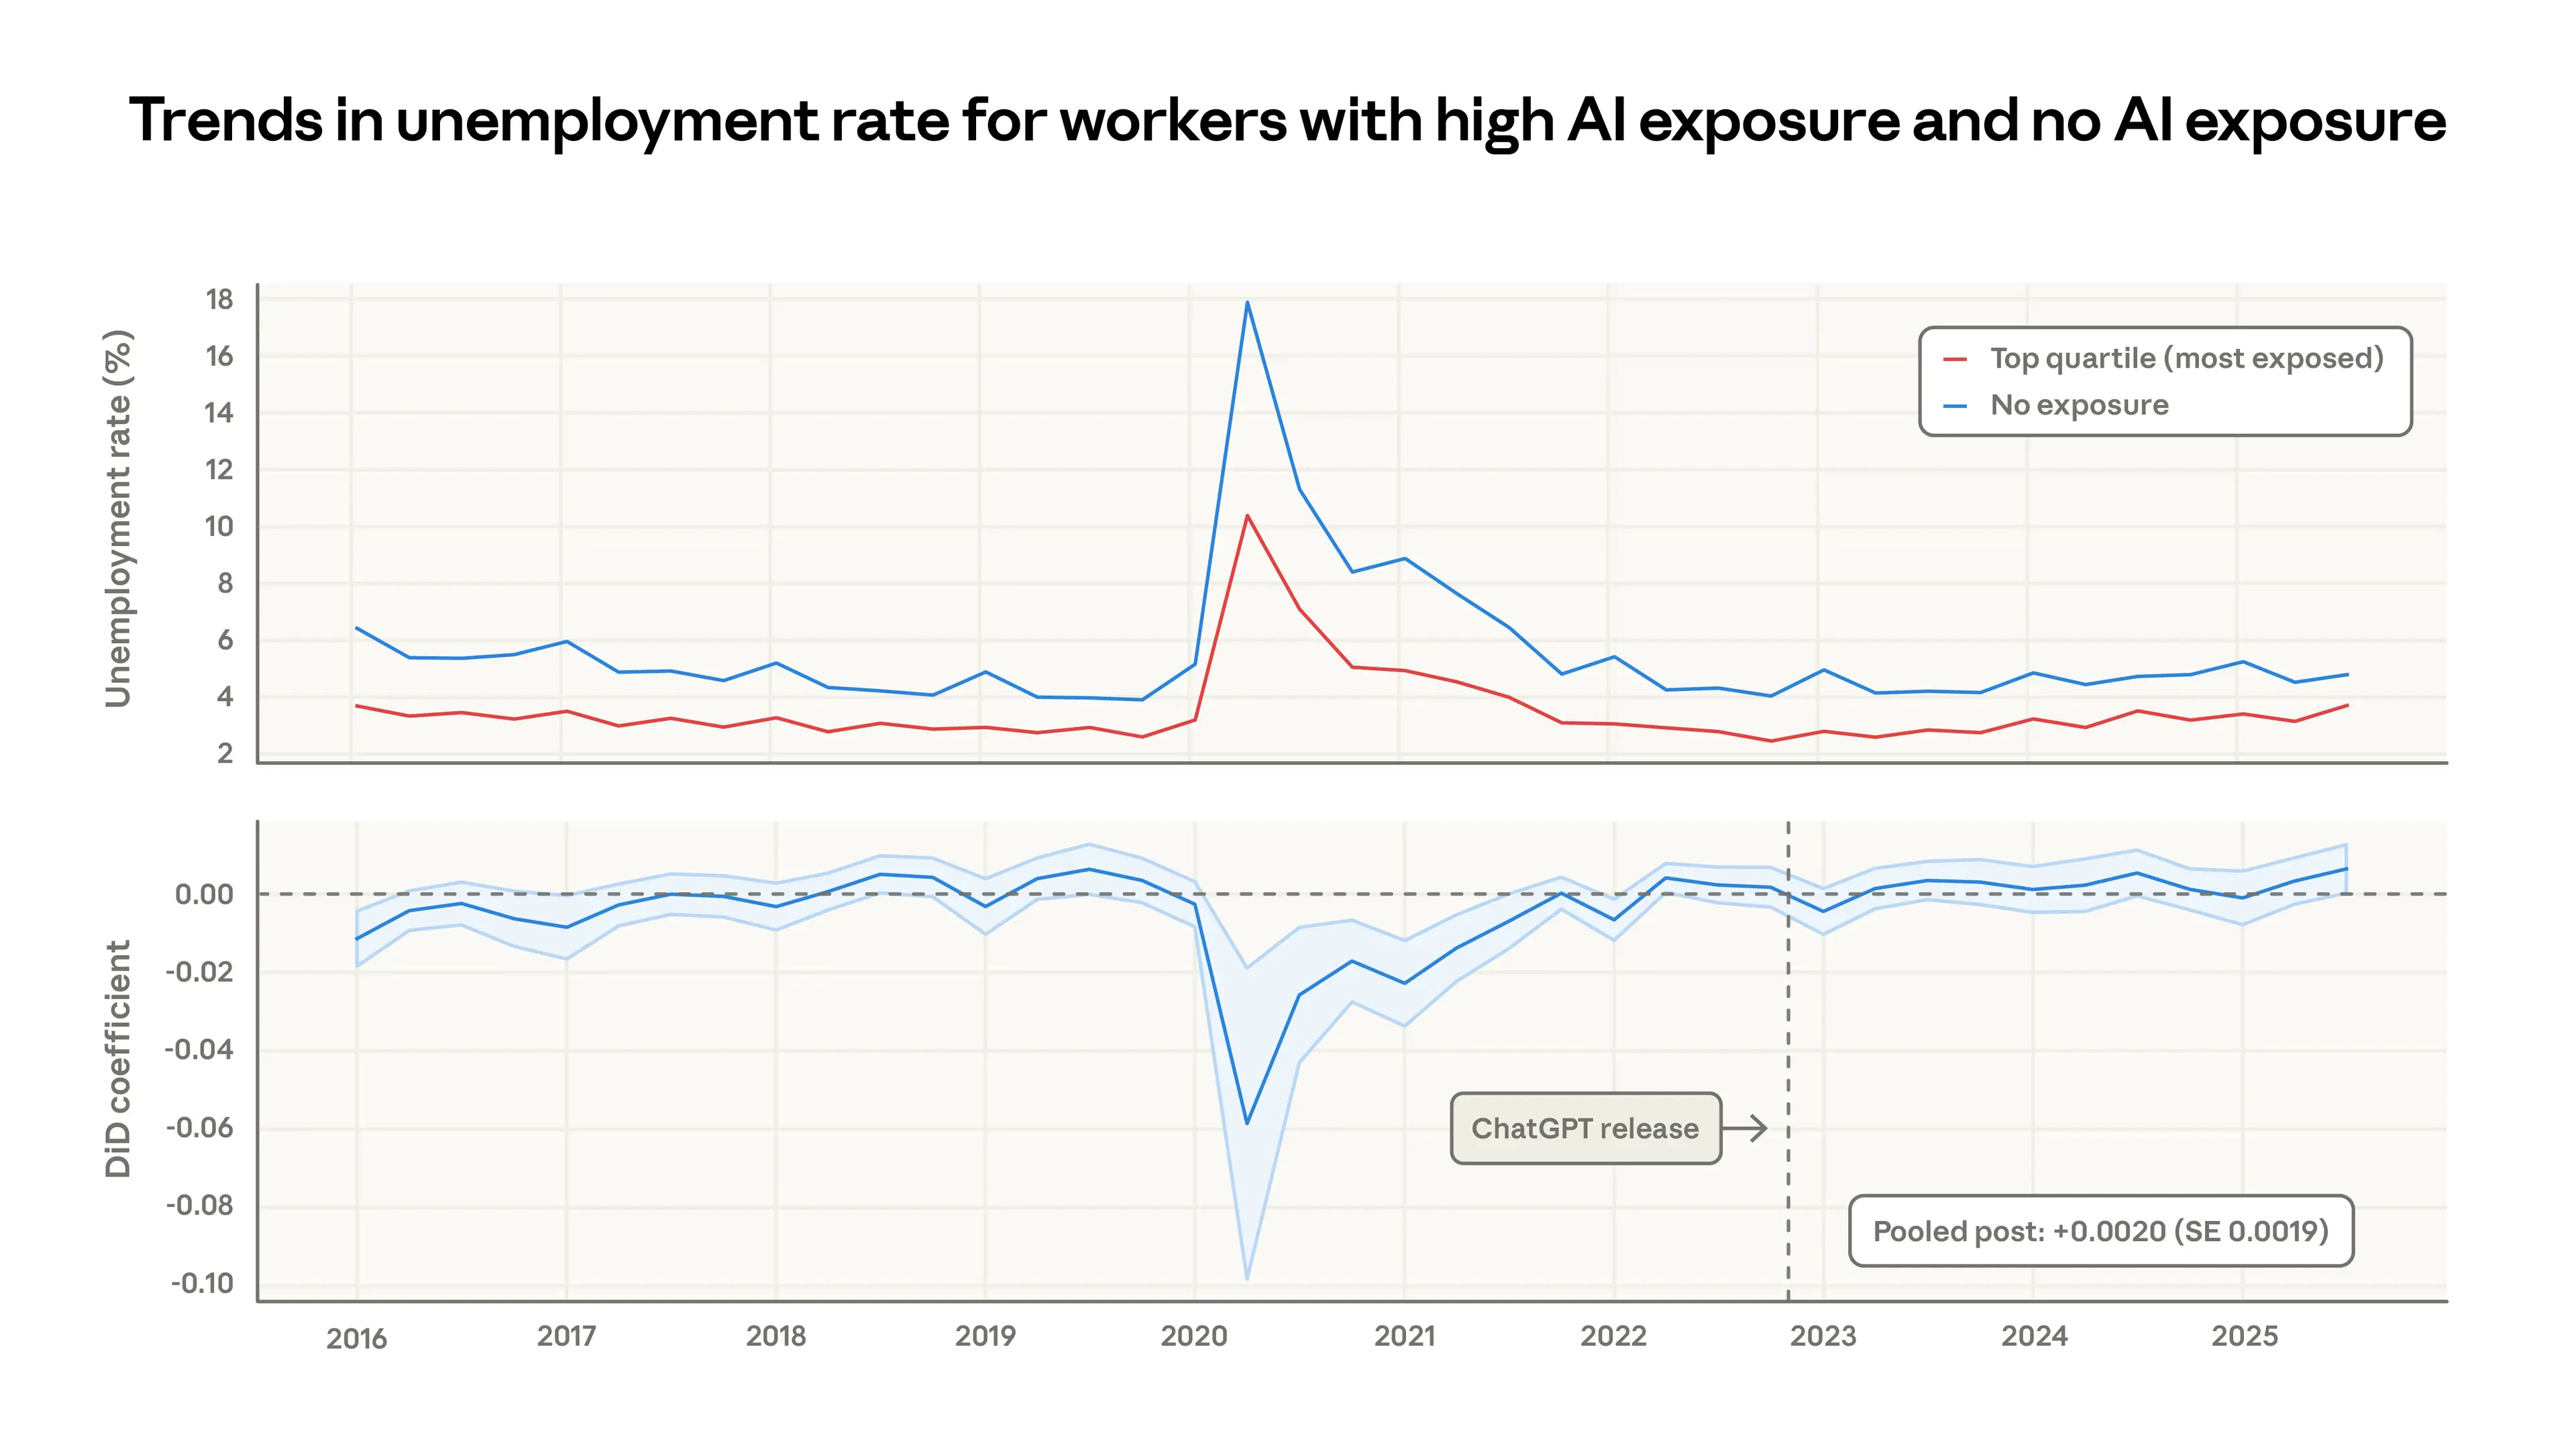
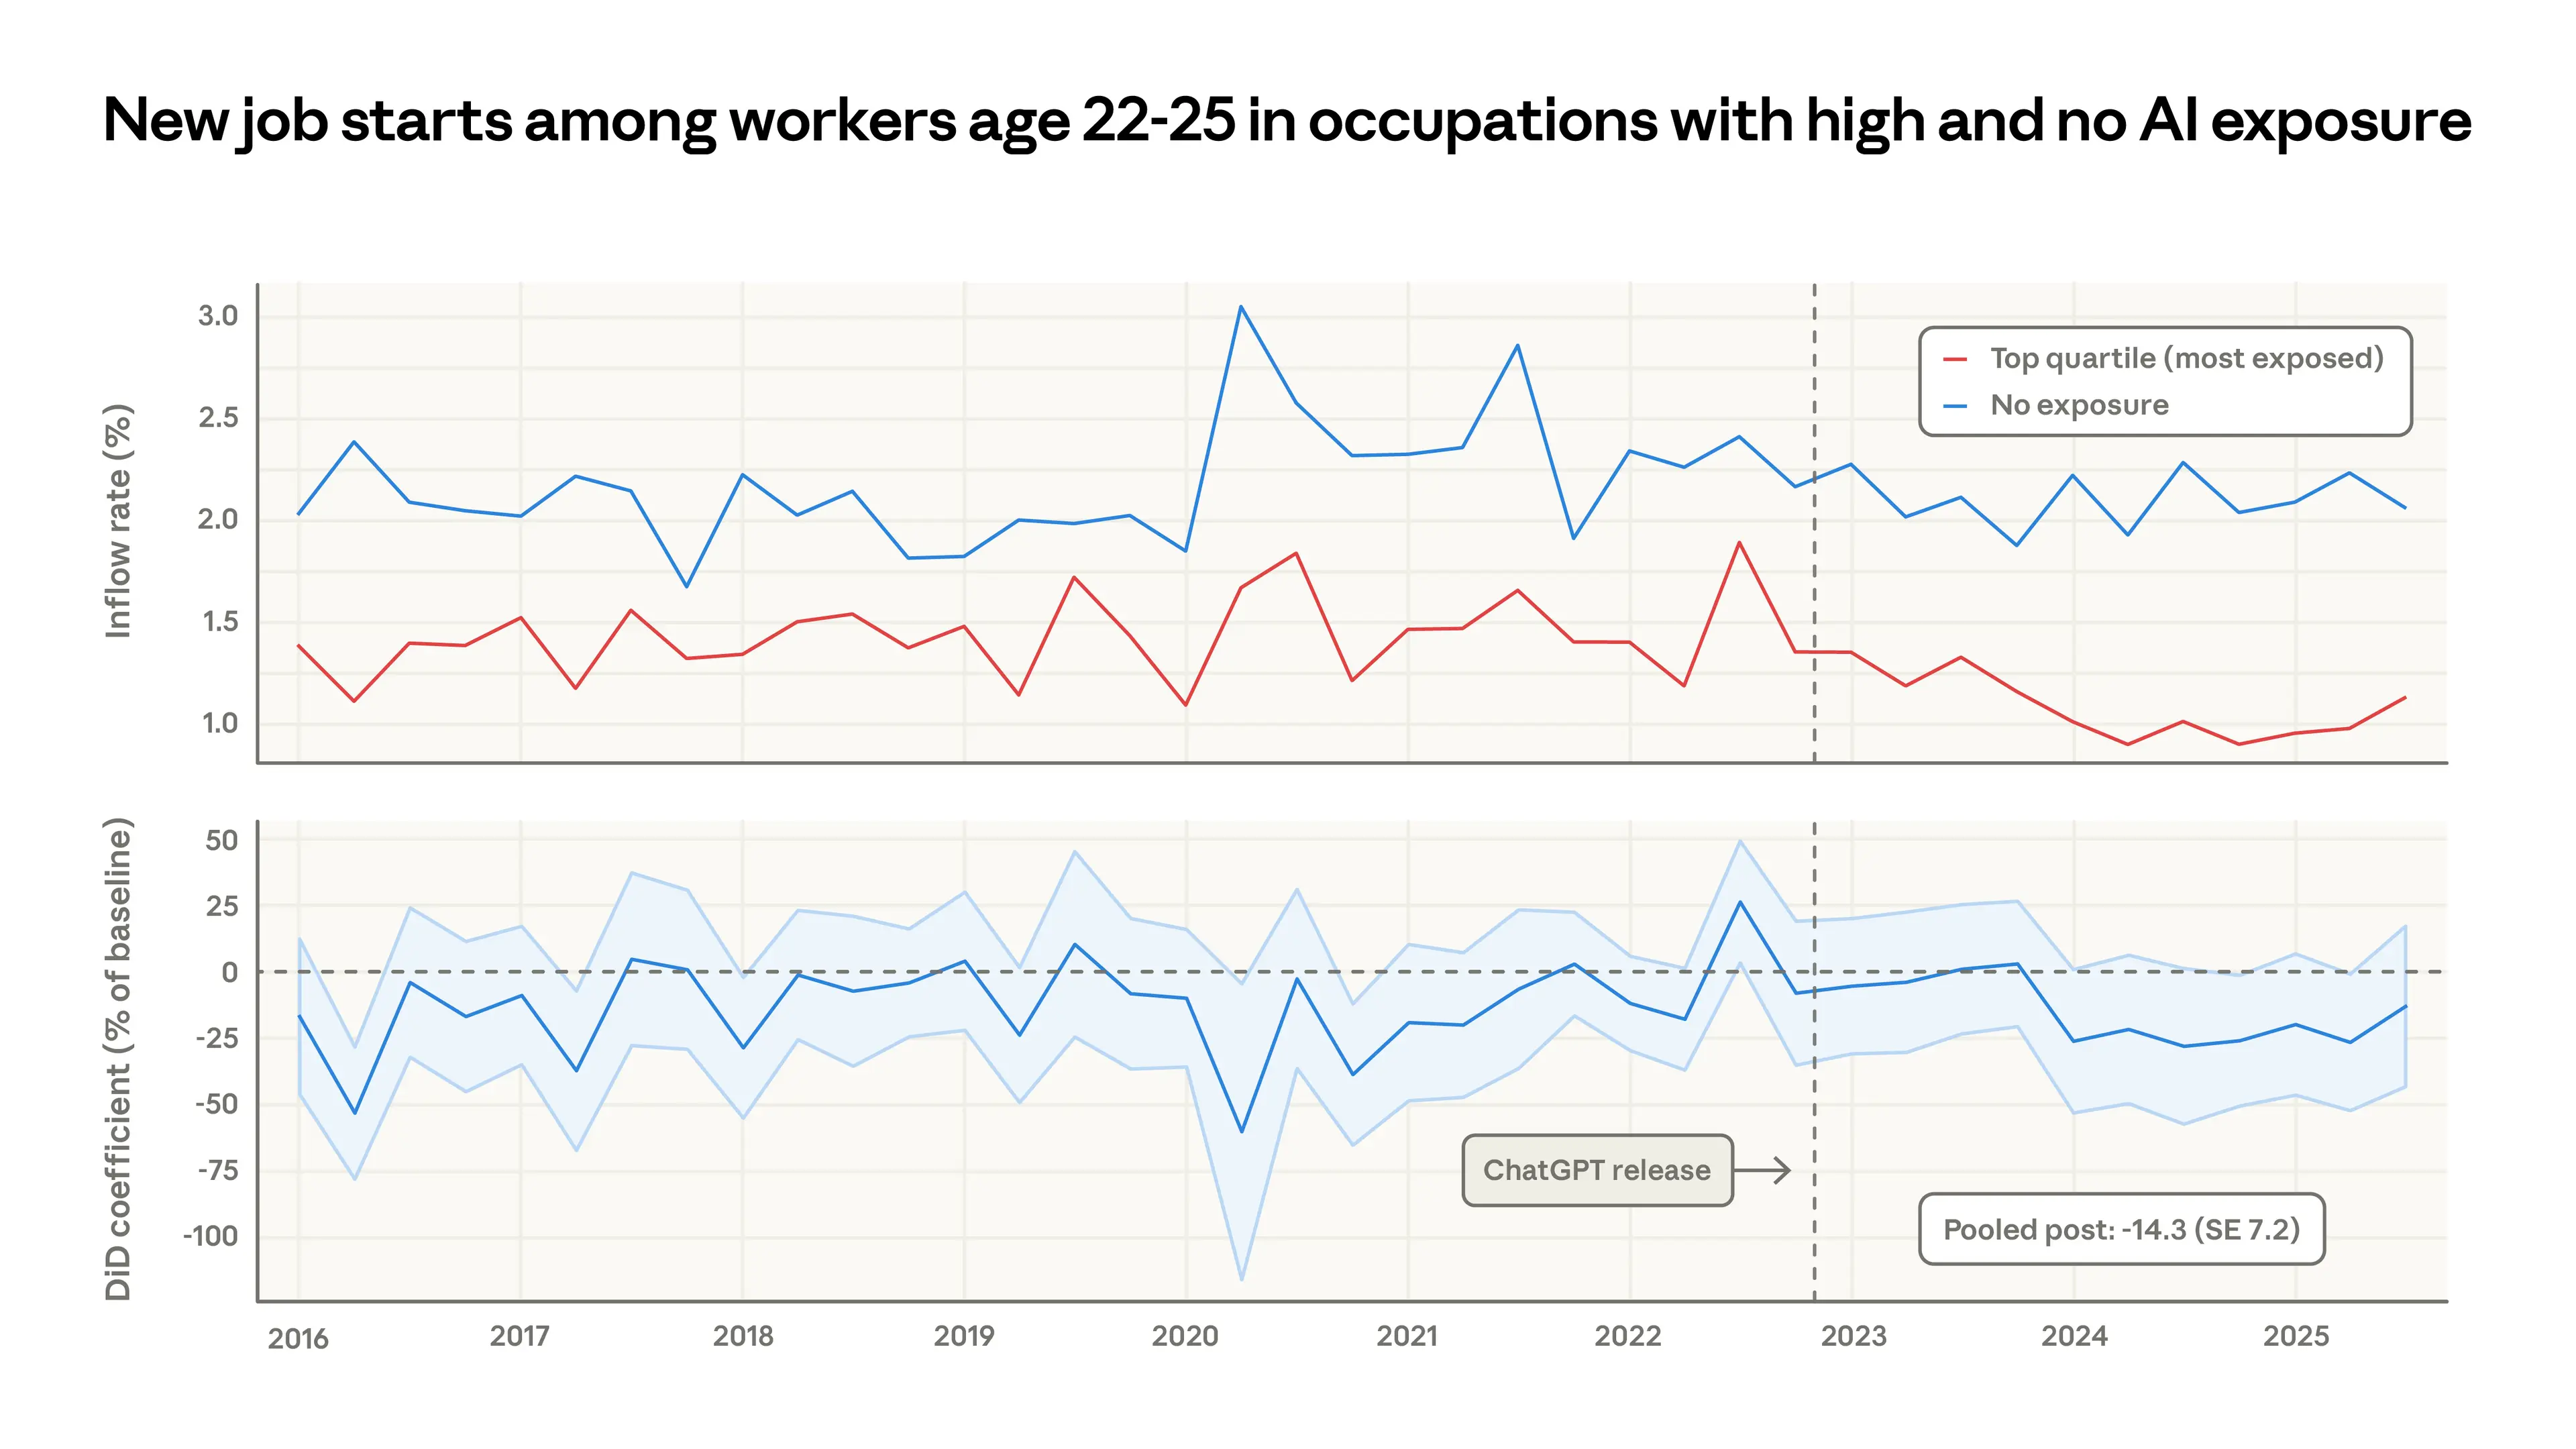
- “We find no systematic increase in unemployment for highly exposed workers since late 2022, though we find suggestive evidence that hiring of younger workers has slowed in exposed occupations”
CES production functions: single substitutability parameter, \(\sigma\)
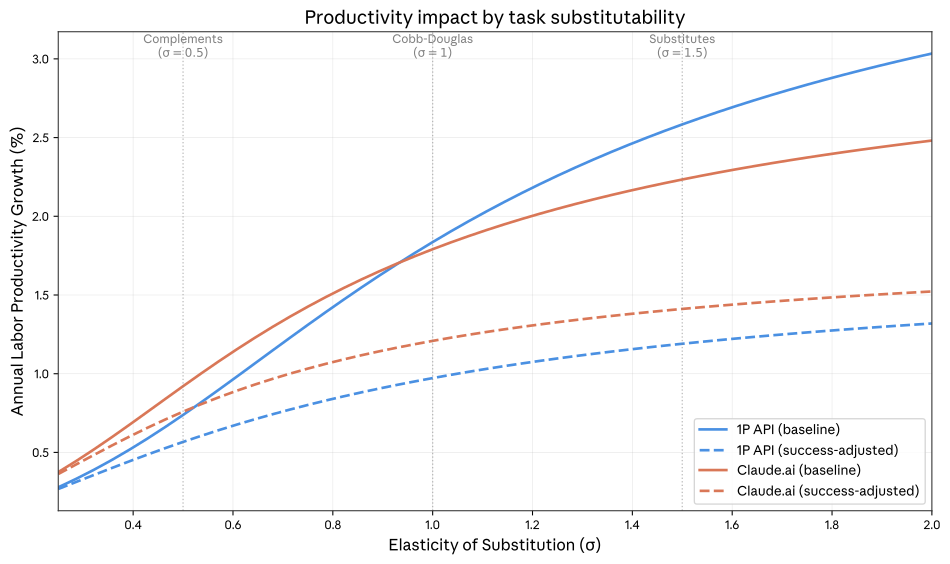
Appel et al. (2026)
- general CES production function: \(y = A \left[ \sum_{i=1}^n a_i X_i^{\frac{\sigma - 1}{\sigma}} \right]^{\frac{\sigma}{\sigma - 1}}\)
- \(\sigma < 1 \Leftrightarrow\) complements: tasks that AI can’t speed up become bottlenecks
So what, big deal?

- is AI exposure = white-collar?
- exploiting O*NET’s graph structure?
- correcting Claude’s time estimates
Correcting Claude’s time estimates (Tamkin & McCrory, 2025)
“We use Claude to estimate how long it would take people to do real-world tasks with and without AI assistance”
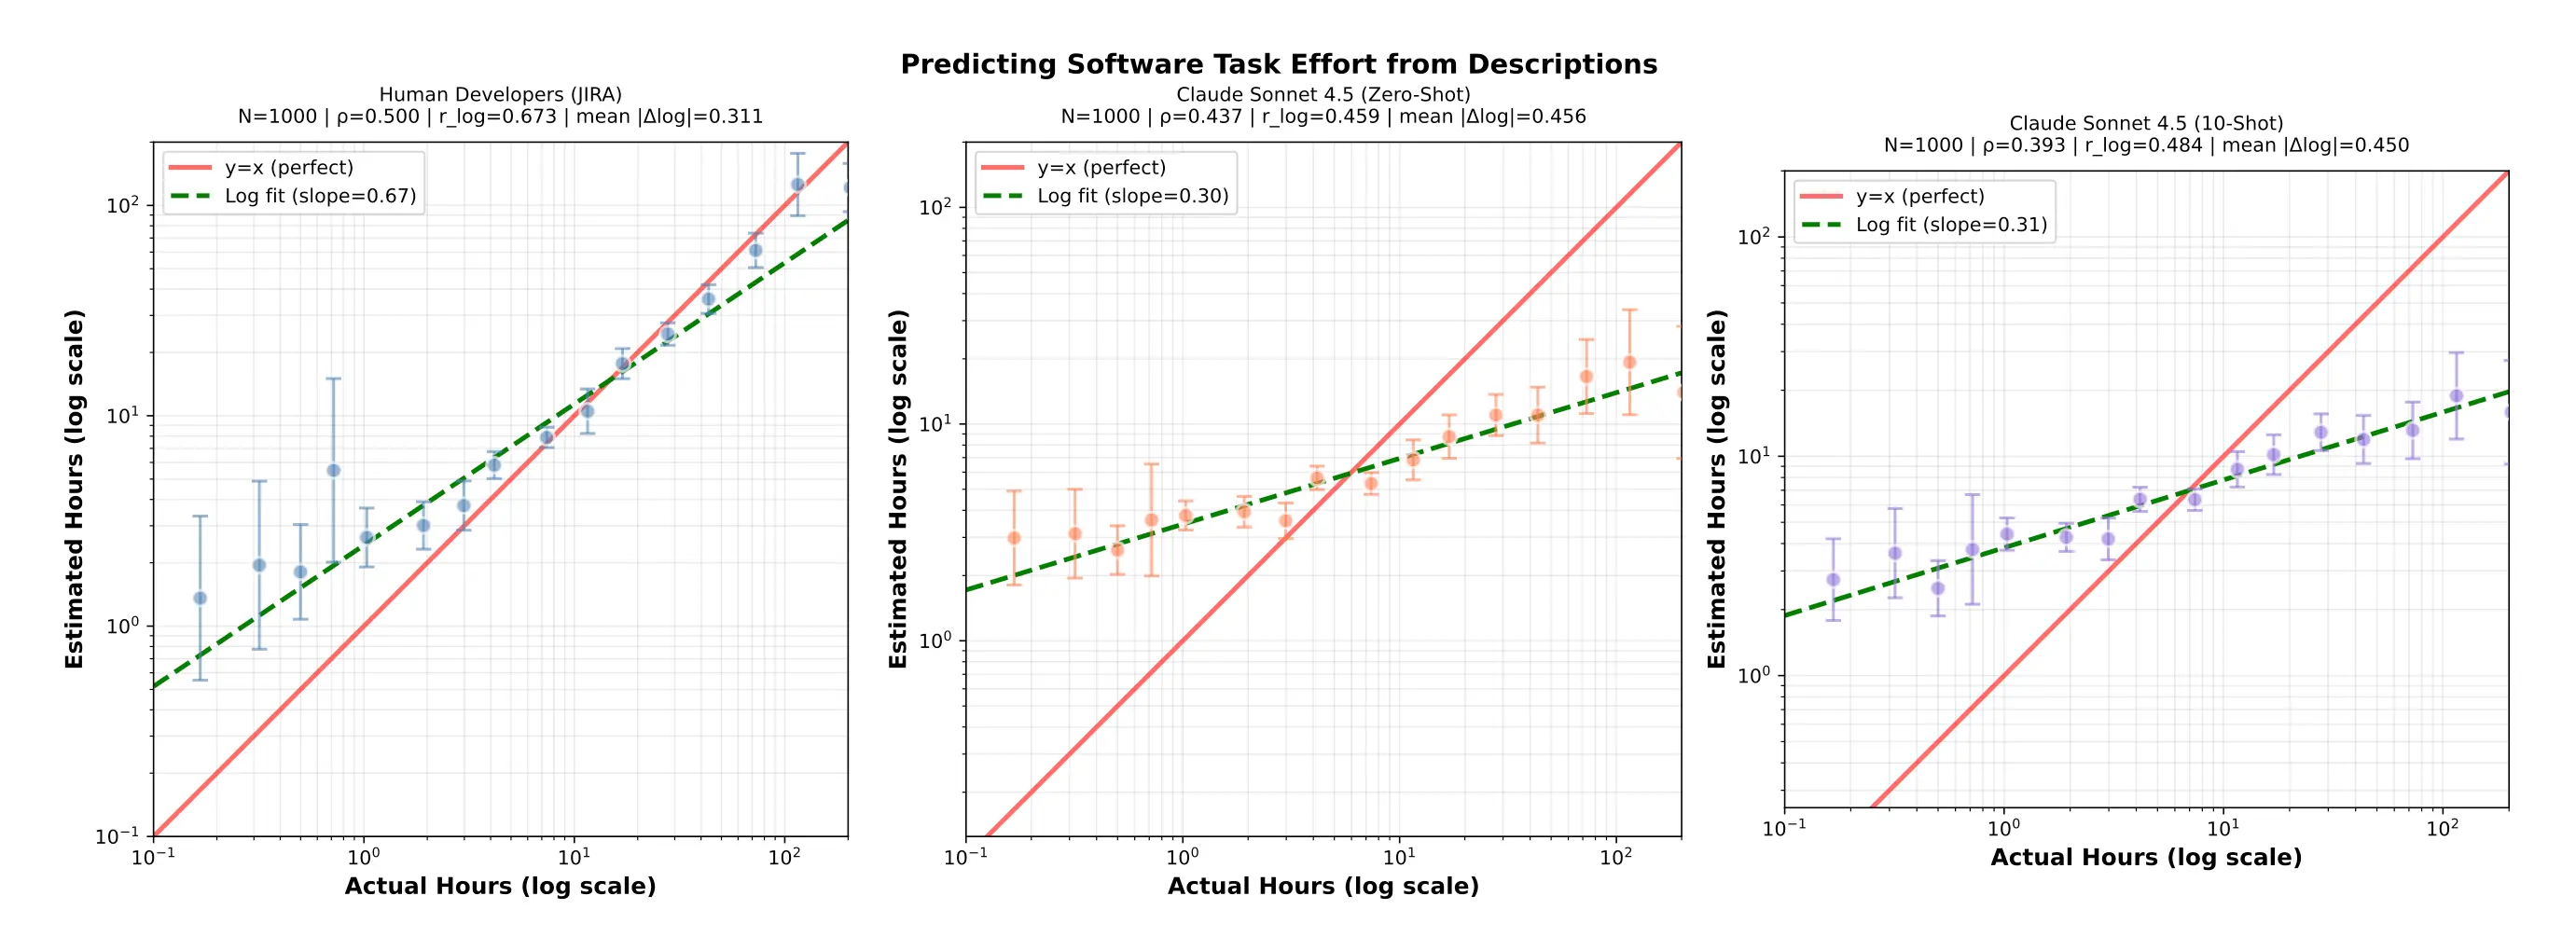
“Claude’s estimates are much more compressed than humans - predicting comparatively long times for shorter tasks, and vice versa - and are overall more prone to overestimates”
- can re-calibrate LLM output: (Ludwig et al., 2025; Zhang et al., 2025)
AI simplifies jobs: low skill workers compete for high skill jobs
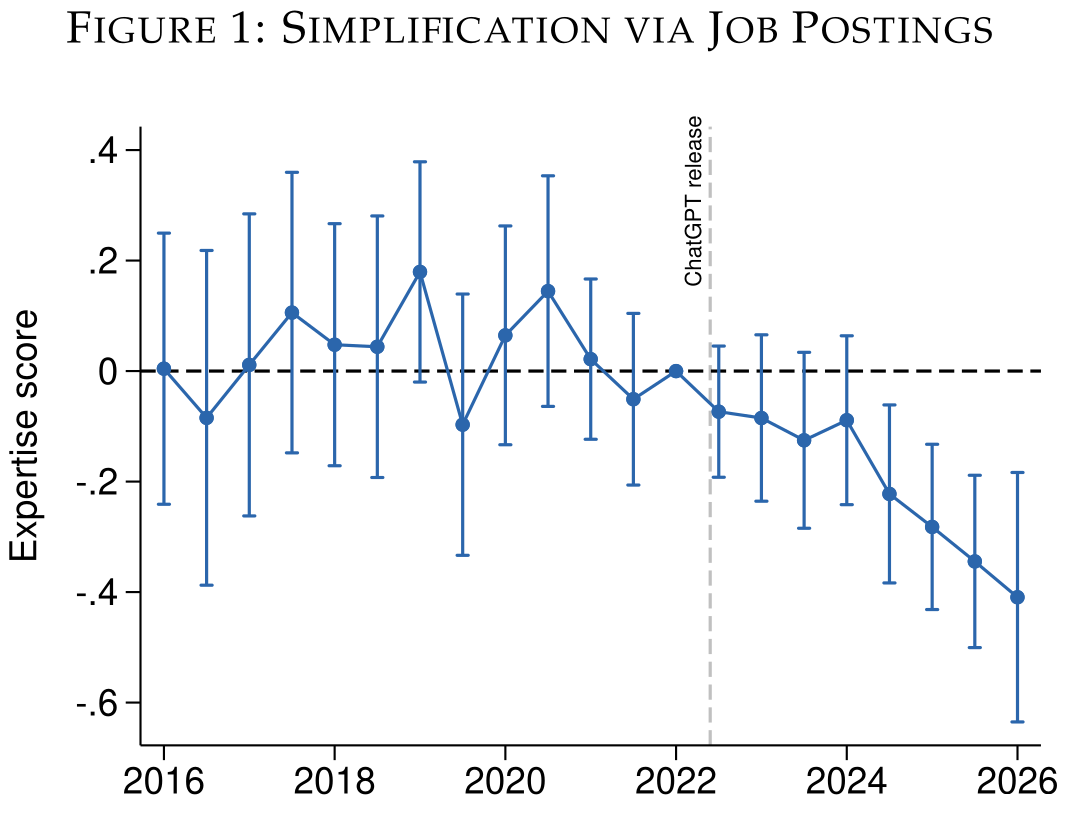
- “occupations predicted to be more simplified by AI exhibit a decline in required expertise in real-time job postings” based on “relative frequency of words”
- every period, workers pick O*NET jobs
- AI support can increase productivity, but may reduce learning
- firms fix workers’ time allocations across tasks
- GE: return to capital, wages determined in equilibrium
- Assumption 2: “automatable tasks are cheaper to perform with capital than with labor”
- calibrated to NLSY79, with some LLM ‘elicitation’
AI simplification compresses the wage distribution
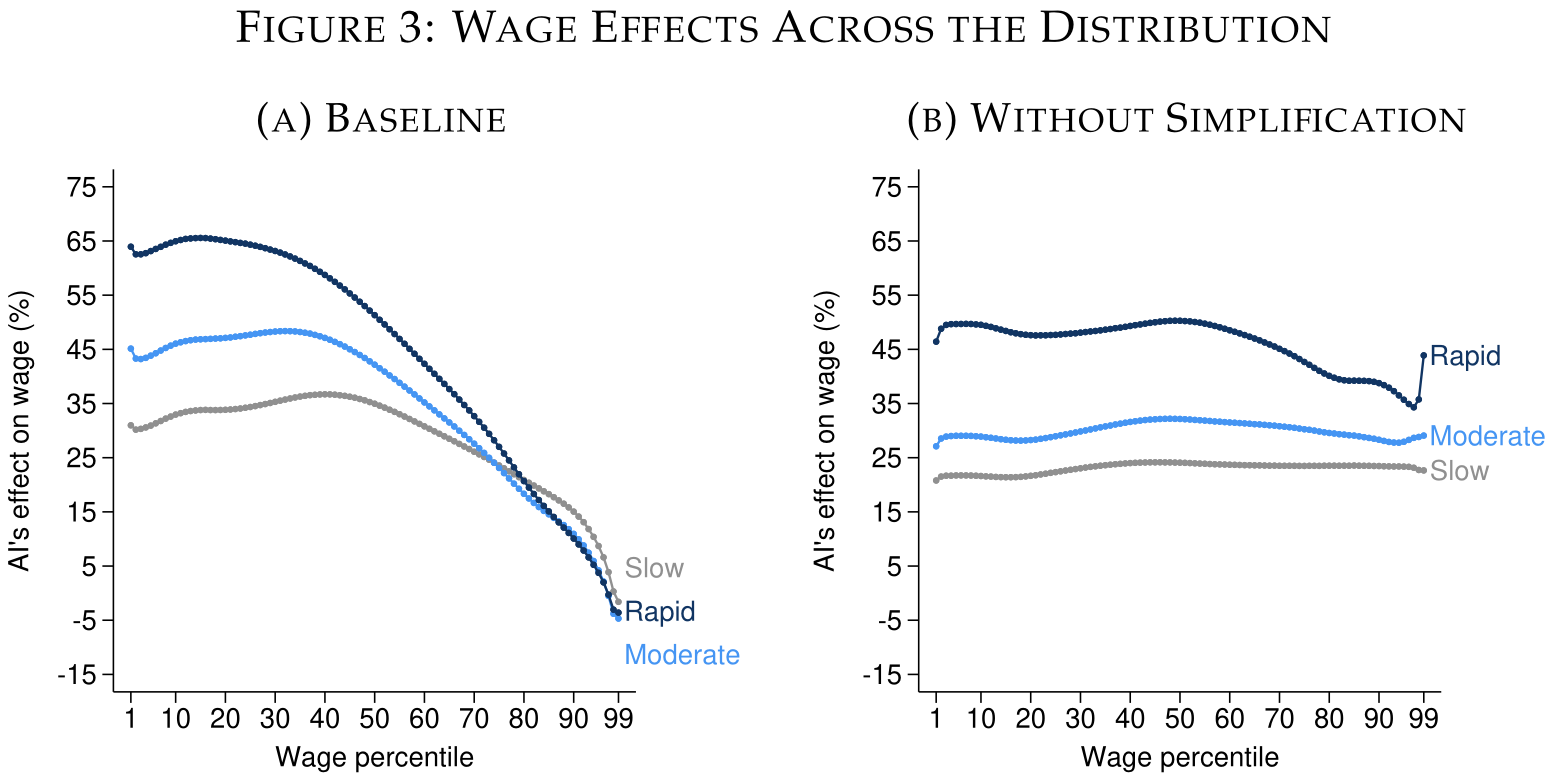
- scenarios from (Karger et al., 2026)
If AI is more expensive for lower skill workers to adopt
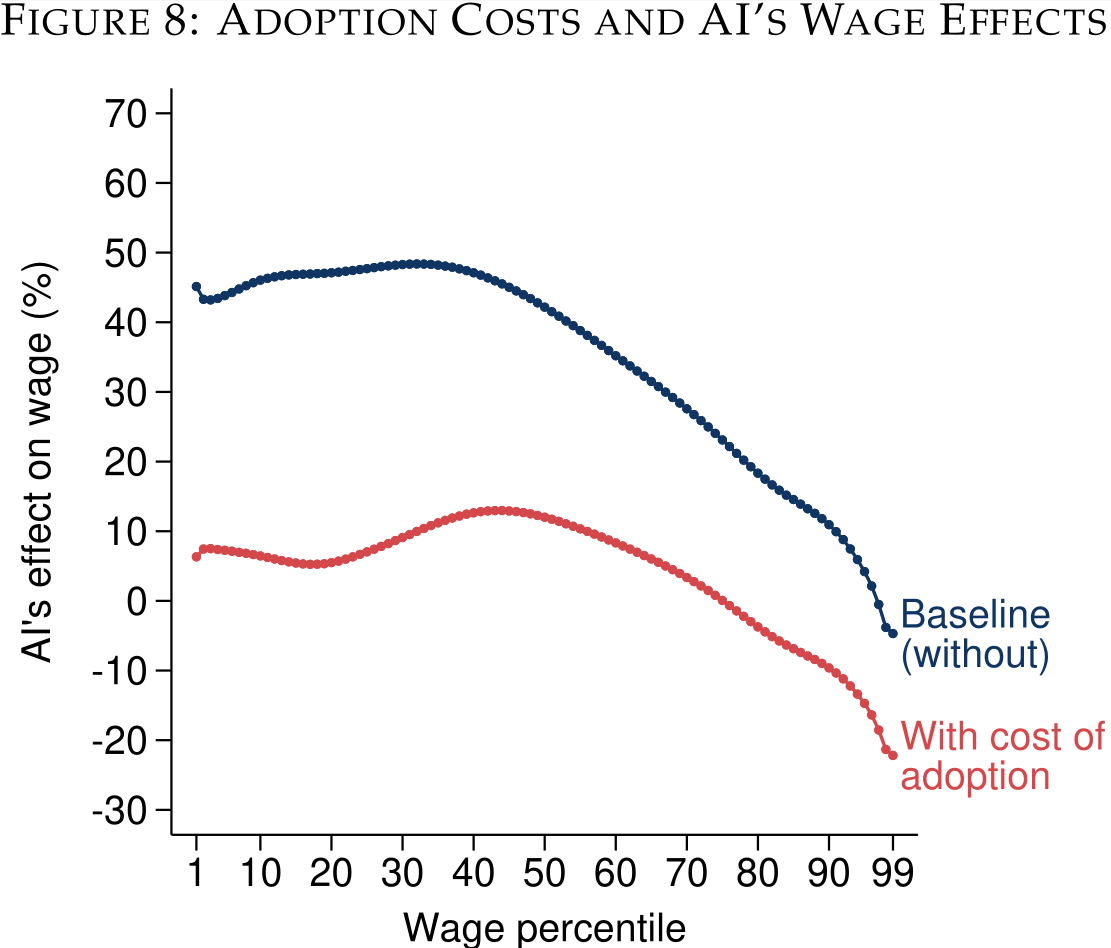
Measuring skills exposure in the AI economy (Chopra et al., 2025)
![]()
-
Modeling 8.4mn agents over 90 steps for US$500 (Chopra, 2025)
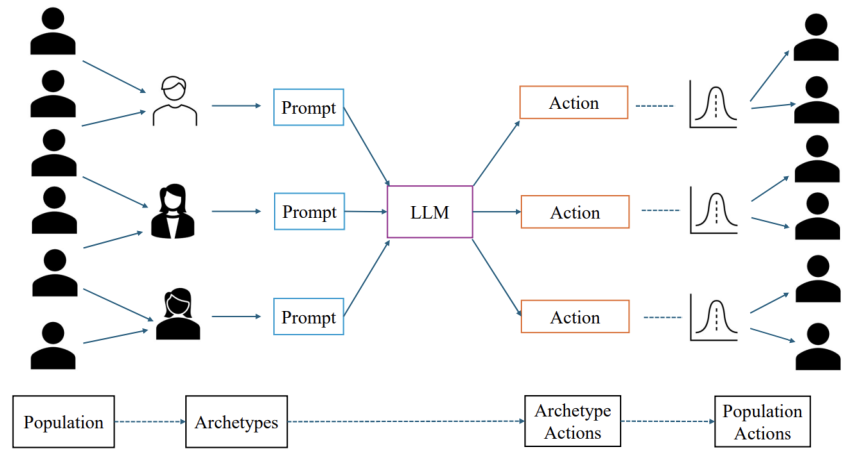
- inputs
- 150,000 attributes \(\times\) 151 mn US workers
- 13,000+ AI workforce
- 2.5 bn human-AI interactions
- outputs
- Surface Index: tech sector exposure
- Iceberg Index: white-collar exposure
David Ricardo’s comparative advantage
| cloth | wine | total | |
|---|---|---|---|
| England | 100 | 120 | 220 |
| Portugal | 90 | 80 | 170 |
